Statistics is the grammar of science.
– Karl Pearson
What is data?
Data is the information collected through different sources that can be qualitative or quantitative in nature.. Mostly, the data collected is used to analyze and obtain information on a particular topic.
For instance:
1. Cylinder size, mileage, color, etc. for the sale of a car
2.Whether cells in the body are malignant or benign to detect cancer
Type of data
Numerical data
Numeric data is information in numbers, namely, numérica que se presenta como una measureThe "measure" it is a fundamental concept in various disciplines, which refers to the process of quantifying characteristics or magnitudes of objects, phenomena or situations. In mathematics, Used to determine lengths, Areas and volumes, while in social sciences it can refer to the evaluation of qualitative and quantitative variables. Measurement accuracy is crucial to obtain reliable and valid results in any research or practical application.... cuantitativa de las cosas.
For instance:
- Heights and weights of people
- Stock prices
a) Discrete data
Discrete data is the information that often tells of some event, namely, can only take specific values. They are often based on whole numbers, but not necessarily.
For instance:
- Number of times a coin was tossed
- People shoe sizes
b) Continuous data
Continuous data is the information that has the possibility of having infinite values, namely, can take any value within a range.
For instance:
How many inches of rain fell on a given day?
Categorical data
This type of data is qualitative in nature and has no inherent mathematical significance.. It is a kind of fixed value under which it is assigned or “categorize” an observation unit.
For instance:
- Gender
- Binary data (Yes / no)
- Attributes of a vehicle as a color, mileage, number of doors, etc.
Ordinal data
This data type is the combination of numeric and categorical data, namely, categorical data that have some mathematical meaning.
For instance:
Restaurant ratings from 1 a 5, being 1 the lowest and 5 the highest
STATISTICS:
Media, medium and mode
To mean
In mathematics and statistics, the mean is the average of the numerical observations which is equal to the sum of the observations divided by the number of observations.

where,
 |
= | meaning arithmetic |
 |
= | number of values |
 |
= | dataset values |
Median
The medianThe median is a statistical measure that represents the central value of a set of ordered data. To calculate it, the data is organized from lowest to highest and the number in the middle is identified. If there are an even number of observations, the two core values are averaged. This indicator is especially useful in asymmetric distributions, since it is not affected by extreme values.... of the data, when arranged in ascending or descending value, is the central observation of the data, namely, the point that separates the upper half from the lower half of the data.
To calculate the median:
- Organize your data in ascending or descending order.
- an odd number of data points: the mean value is the median.
- even number of data points: the average of the two mean values is the median.

 |
= | an ordered list of values in the data set |
 |
= | number of values in the data set |
Way
the way of a set of data points is the most frequent value.
For instance:
5, 2,6,5, 1,1,2,5, 3,8,5, 9,5 are the set of data points. Here 5 is the way because it happens more frequently.
Variance and standard deviation
Difference
Mathematically and statistically, difference is defined as the average of the squared differences from the mean. But to understand, this describes how extended the data is in a data set.
The steps to calculate the variance using an example:
Let's find the variance of (1,4,5,4,8)
- Find the mean of the data points namely (1 + 4 + 5 + 4 + 8) / 5 = 4.4
- Find the differences with the mean namely (-3,4, -0,4, 0,6, -0,4, 3,6)
- Find the differences squared namely (11,56, 0,16, 0,36, 0,16, 12,96)
- Find the average of the squared differences namely, 11,56 + 0,16 + 0,36 + 0,16 + 12,96 / 5 = 5,04
The formula for the same is:

Standard deviation
Standard deviation measures the variation or spread of data points in a data set. Represents the closeness of the data point to the mean and is calculated as the square root of the variance.
In data science, standard deviation is generally used to identify outliers in a data set. Data points that are within one standard deviation of the mean are considered unusual.
The formula for the standard deviation is:

 |
= | population standard deviation |
 |
= | the size of the population |
 |
= | each population value |
 |
= | the population mean |
Population data V / s Sample data
Population data refers to the complete data set, while Sample data refers to a part of the population data that is used for analysis. Sampling is done to facilitate analysis.
When using sample data for analysis, the variance formula is slightly different. If there are a total of n samples, we divide by n-1 instead of n:
 |
= | sample variance |
 |
= | the value of an observation |
 |
= | the mean value of the observations |
 |
= | the number of observations |
PROBABILITY:

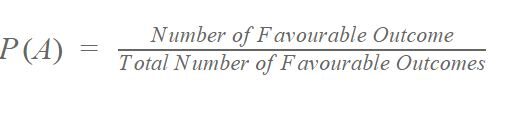
What is probability?
The concept of probability is extremely simple. It means the probability of an event occurring or the probability of an event occurring.
The probability formula is:
 For instance:
The probability that the coin will show heads when tossed is 0,5.
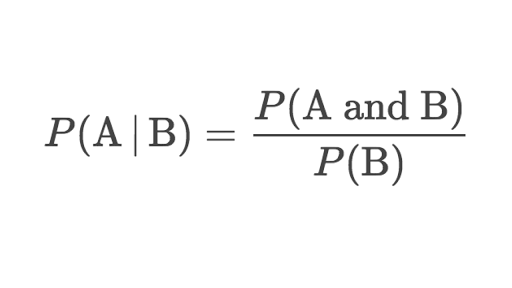
The conditional probability
The conditional probability is the probability that an event occurs as long as another event has already occurred.
The conditional probability formula:
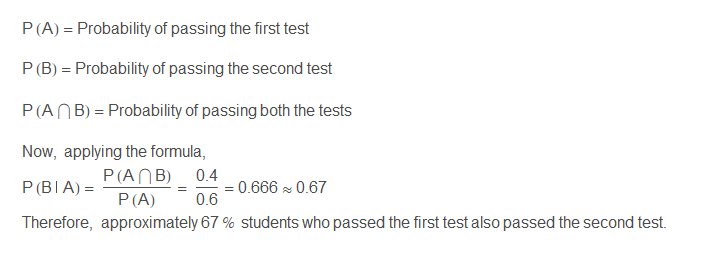
For instance:
The students of a class have taken two tests of the subject Mathematics. In the first test, the 60% of students pass while only the 40% of students pass both tests. What percentage of students who passed the first test, they passed the second test?
Teorema de Bayes
Bayes' theorem is a very important statistical concept that is used in many industries., like health and finances. The conditional probability formula that we have done previously has also been derived from this theorem.
Used to calculate the probability of a hypothesis based on the probabilities of various data provided in the hypothesis.
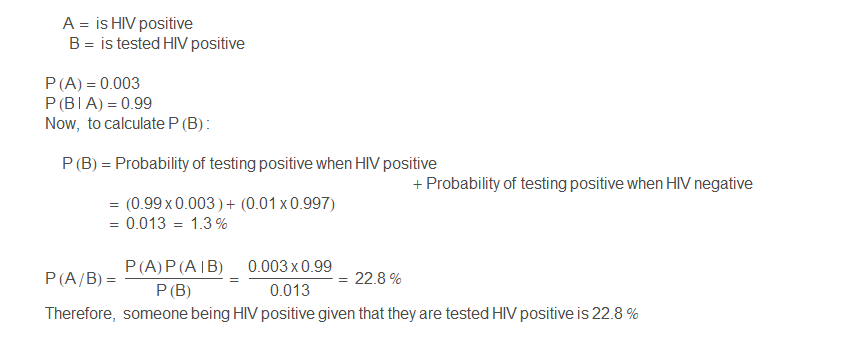
The formula of Bayes' theorem is:

 |
= | events |
 |
= | probability of A given B is true |
 |
= | probability of B given A is true |
 |
= | the independent probabilities of A and B |
For instance:
Suppose there is an HIV test that can identify HIV patients + positive accurately the 99% of the times, and that also has a negative result with precision for the 99% of HIV negative people. Here, only the 0,3% of the total population is seropositive.
CONCLUSION
The statistics and probability topics covered in the article are really important, but there are many other topics like probability distribution functions and their types, covariance and correlation, etc. which have not been covered here because they require separate attention due to their graphic. nature.
Mathematics and statistics are the heart of data science. The topics covered in this article are the foundation of many algorithms, formulas for calculating errors and graphical understanding of things, so they are very important and cannot be ignored.


