
Rule-Based Sentiment Analysis in Python for Data Scientists
This article was published as part of the Data Science Blogathon Author's image taken online at befunky.com According to experts, the 80%
This article was published as part of the Data Science Blogathon Author's image taken online at befunky.com According to experts, the 80%

This article was published as part of the Data Science Blogathon Like the Evolution of Humans, the visualization techniques of

This article was published as part of the Data Science Blogathon. Introduction Artificial intelligence has been greatly improved without the need to change the

Introduction Python is one of the most beloved languages in the world of data science and machine learning. Is easy to learn
Overview Mode is a data science platform that brings together an SQL editor, a Python notebook and R Can perform data visualization,
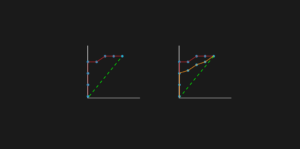
Curva AUC-ROC: The star artist! You have created your machine learning model, then, Whats Next? You must evaluate it and validate how good (or bad) it is,

Introduction Today, one of the trendy social media platforms is .... guess what? A single WhatsApp😅. It is one of the platforms of
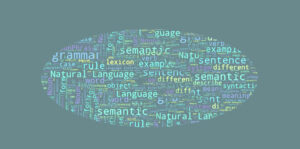
Word Clouds turned out to be a revolutionary visualization technique for understanding and determining evolving patterns and trends.. Whether to discover political agendas

Topic to be covered What is exploratory data analysis? What is the need to automate exploratory data analysis? Bibliotecas de Python para

Introduction I'm a big fan of R, it's no secret. I've trusted him since I learned statistics in college. In fact, R

I will be direct: Most web developers commit a GDPR violation every week without knowing it. When a client sends you the photos of their

In a world where sustainability drives change in the automotive industry, electric vehicles (EV) and hybrids are gaining ground among buyers