Introduction
Artificial intelligence and machine learning will be our biggest helper in the next decade!!
Today in the morning, I was reading an article that reported that an artificial intelligence system won against 20 lawyers and lawyers were really happy that artificial intelligence can take care of a repetitive part of their roles and help them work on complex issues. These lawyers were pleased that artificial intelligence enables them to perform more satisfying roles.
Today, I will share a similar example: how to count the number of people in a crowd using Deep learningDeep learning, A subdiscipline of artificial intelligence, relies on artificial neural networks to analyze and process large volumes of data. This technique allows machines to learn patterns and perform complex tasks, such as speech recognition and computer vision. Its ability to continuously improve as more data is provided to it makes it a key tool in various industries, from health... and machine vision? But, before doing that, Let's develop a sense of how easy life is for a crowd counting scientist.
Act like a crowd counting scientist
Let us begin!
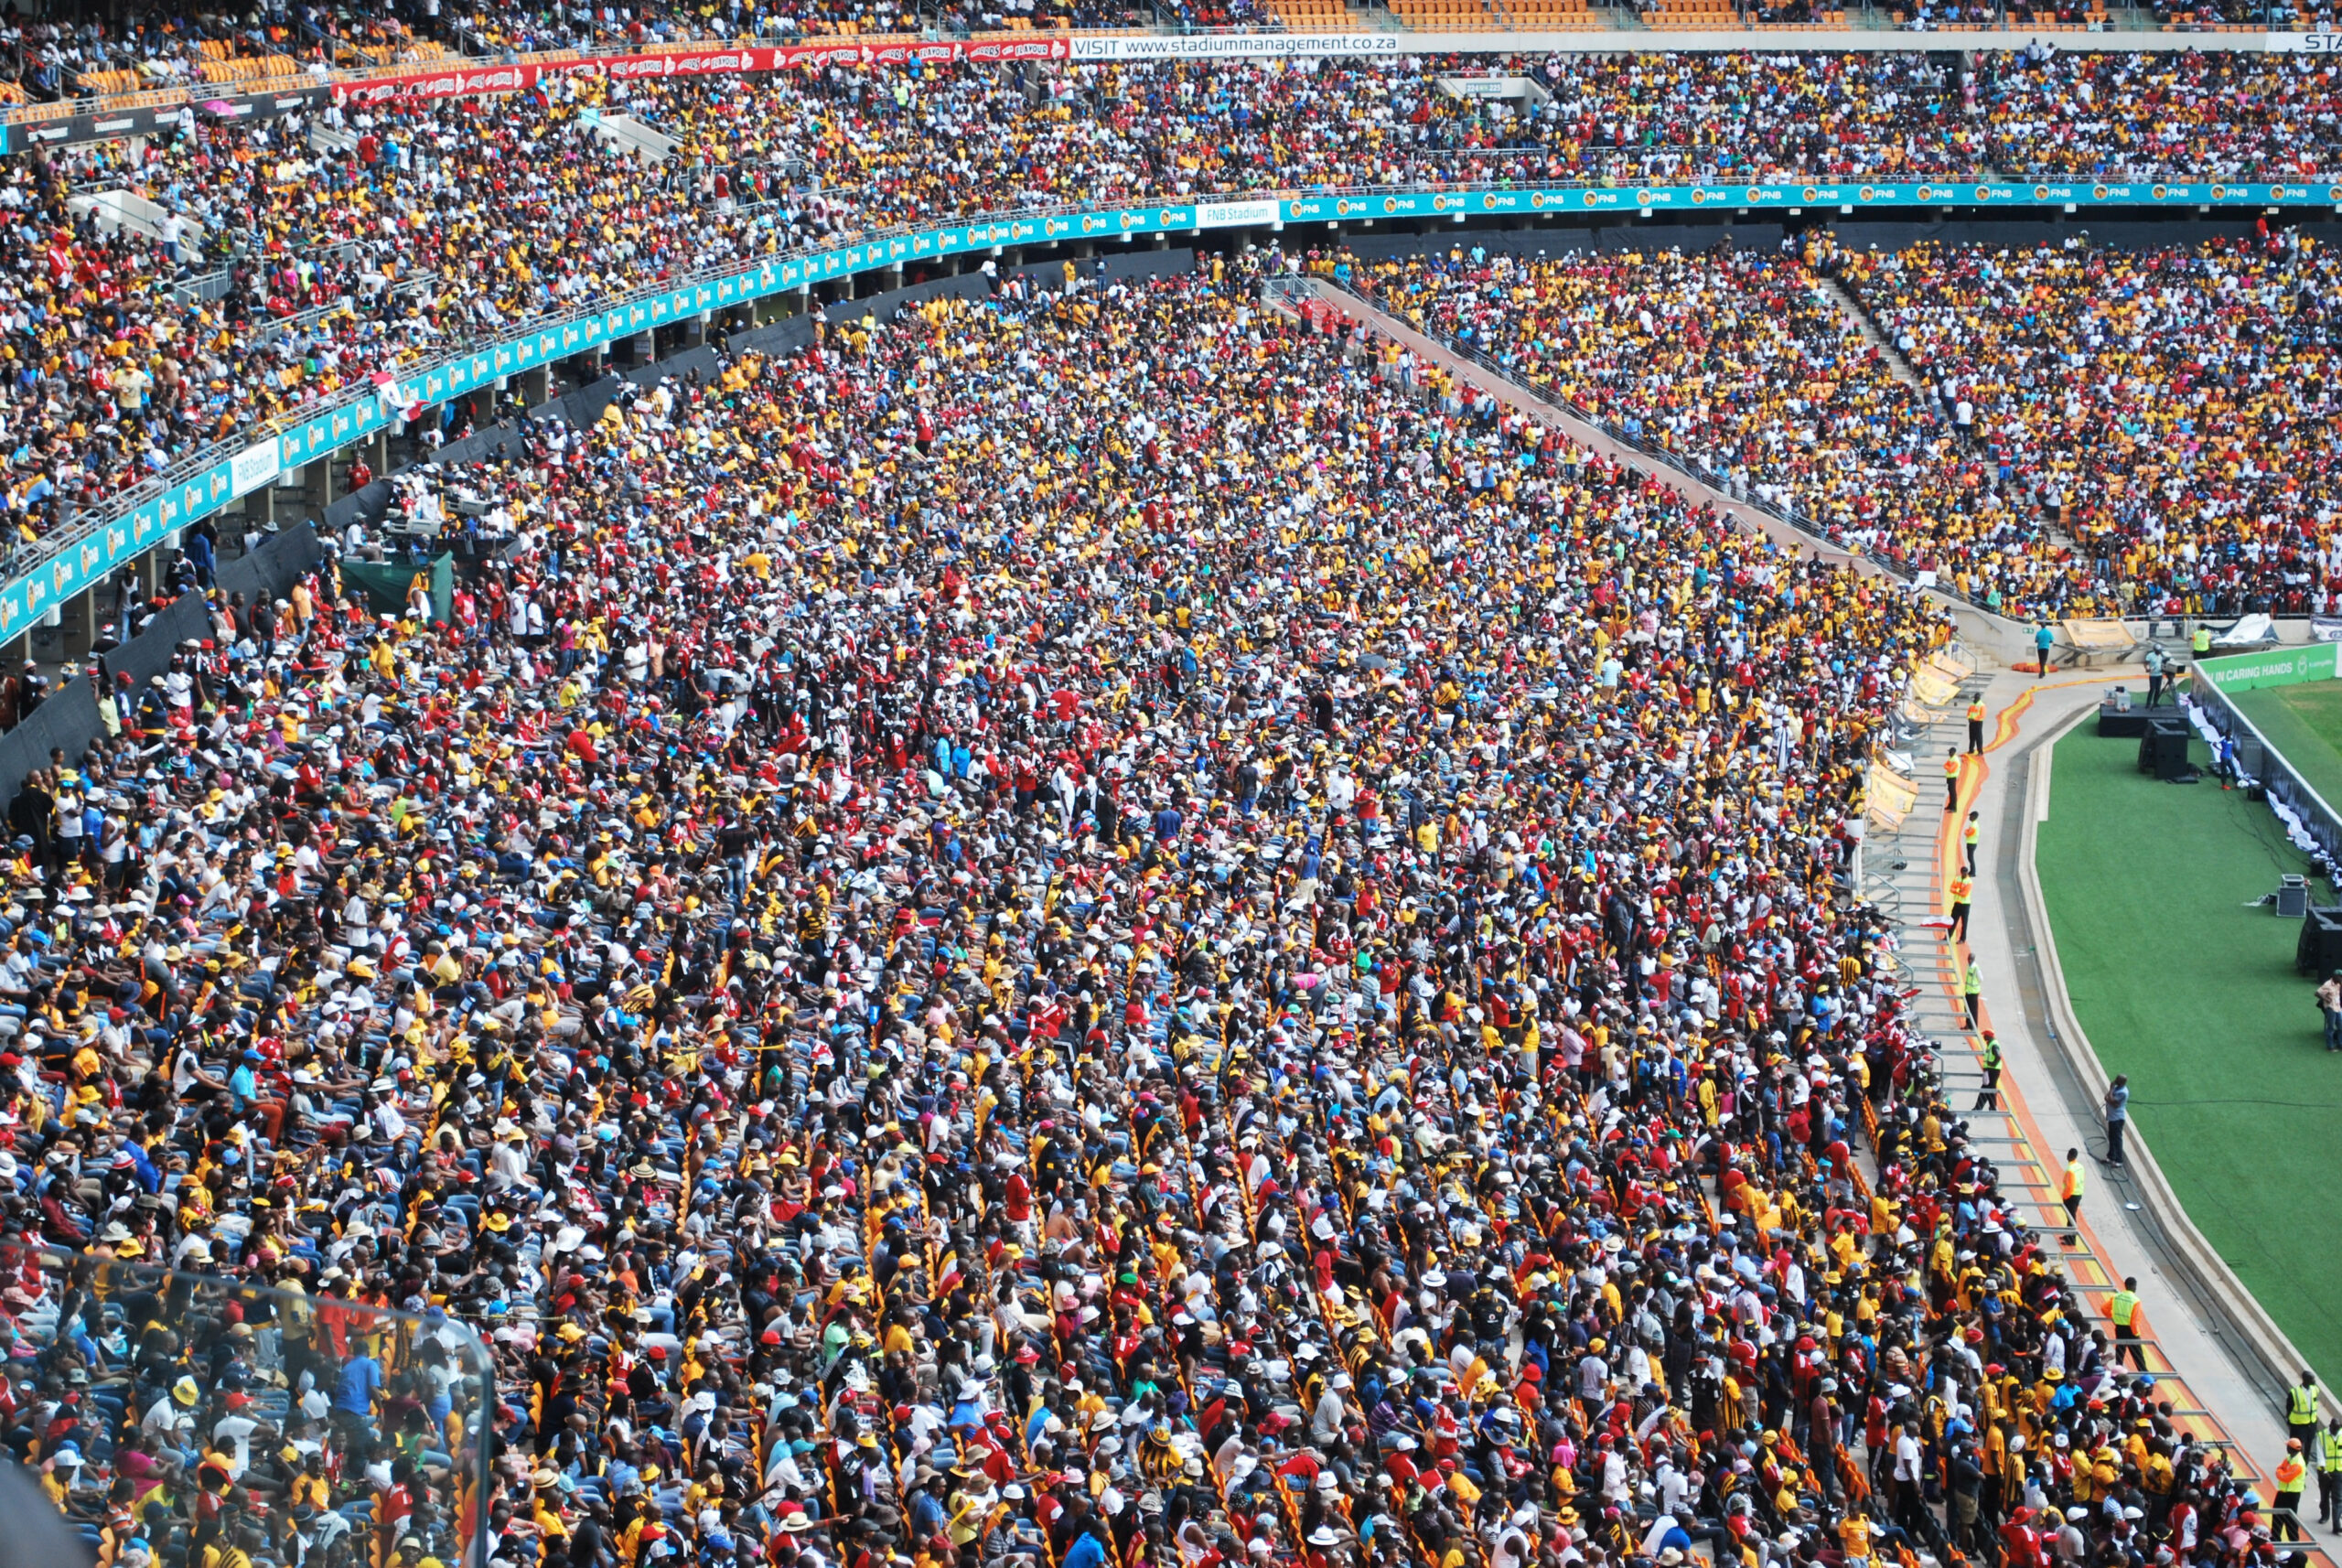
Can you help me count / estimate the number of people in this image who will attend this event?
Ok, what about this one?
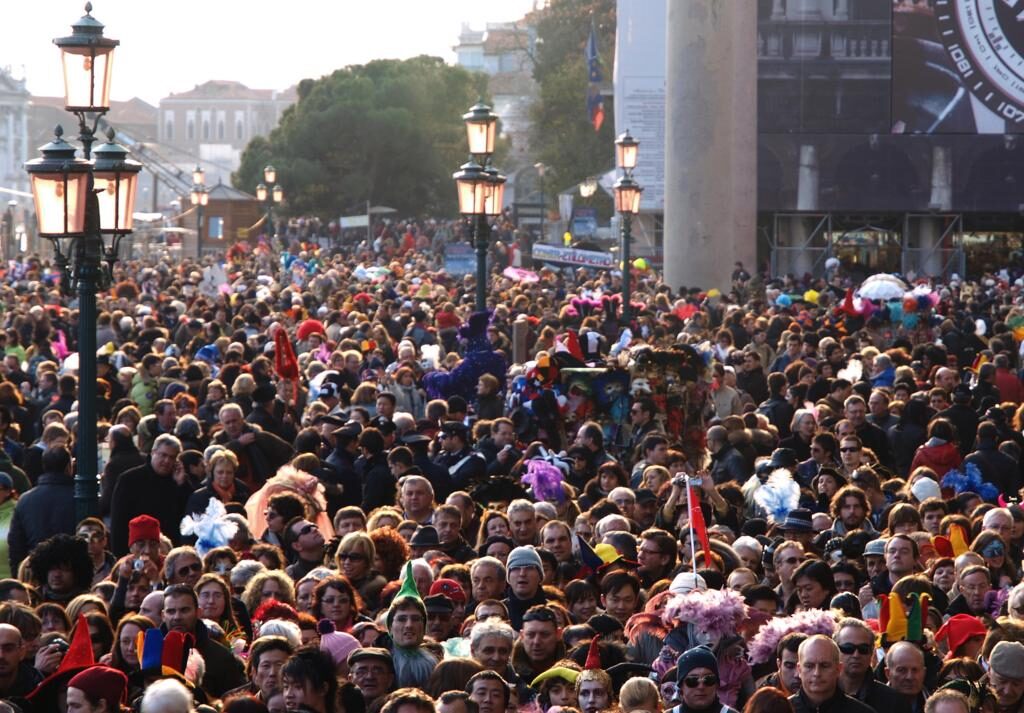
Source: ShanghaiTech dataset
You get the hang of it. At the end of this tutorial, we will create an algorithm for crowd counting with astonishing precision (compared to humans like you and me). Will you use such an assistant?
PD This article assumes that you have a basic understanding of how convolutional neural networks work. (CNN). You can refer to the post below for more information on this topic before proceeding.:
Table of Contents
- What is crowd counting?
- Why is crowd counting required?
- Understanding of different computer vision techniques for crowd counting
- CSRNet architecture and training methods
- Building Your Own Crowd Counting Model in Python
This article is very inspired by the article: CSRNet: Dilated convolutional neural networks to understand highly congested scenes.
What is crowd counting?
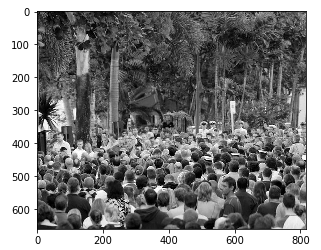
Crowd counting is a technique for counting or estimating the number of people in an image. Take a moment to analyze the following image:
Source: ShanghaiTech dataset
Can you give me an approximate number of how many people are in the box? Yes, including those present in the background. The most direct method is to manually count each person, but does that make practical sense? It's almost impossible when the crowd is so large!
The Crowd Scientists (Yes, That's a real job title!) They count the number of people in certain parts of an image and then extrapolate to arrive at an estimate. More commonly, we've had to rely on raw metrics to estimate this number for decades.
Surely there must be a better and more accurate approach.
Yes there are!
Although we still do not have algorithms that can give us the EXACT number, the majority computer vision Techniques can produce impressively accurate estimates. Let's first understand why crowd counting is important before diving into the algorithm behind it..
Why is crowd counting useful?
Let's understand the usefulness of crowd counting with an example. Imagine this: your company just finished hosting a big data science conference. During the event many different sessions were held.
You are asked to analyze and estimate the number of people who attended each we can apply transformations once for the whole cluster and not for different partitions separatelyThe "Session" It is a key concept in the field of psychology and therapy. Refers to a scheduled meeting between a therapist and a client, where thoughts are explored, Emotions and behaviors. These sessions can vary in length and frequency, and its main purpose is to facilitate personal growth and problem-solving. The effectiveness of the sessions depends on the relationship between the therapist and the therapist... This will help your team understand what kinds of sessions drew the largest crowds. (and which ones failed in that sense). This will shape next year's conference, So it is an important task!
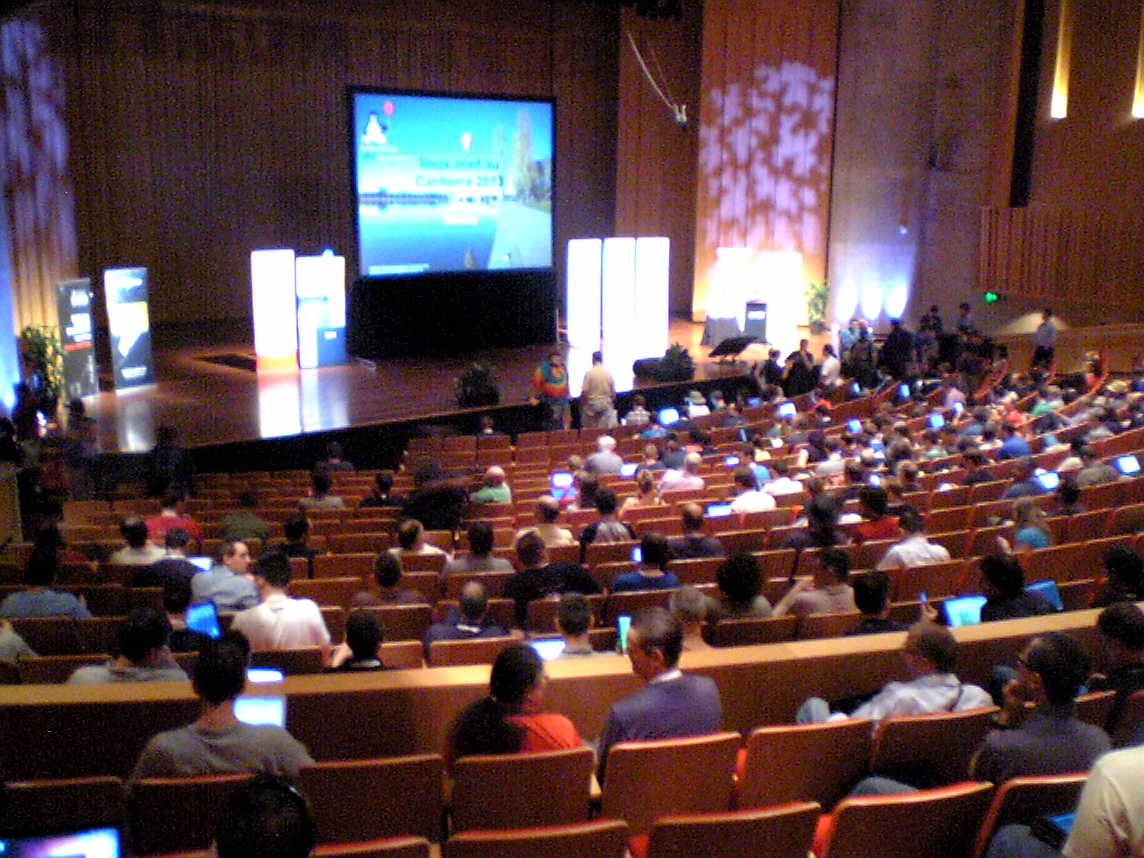
There were hundreds of people at the event, Counting them manually will take days! That's where your skills as a data scientist come in.. He managed to get photos of the crowd at each shoot and create a computer vision model to do the rest!!
There are many other scenarios where crowd counting algorithms are changing the way industries work.:
- Counting the number of people who attend a sporting event
- Estimate how many people attended an inauguration or march (political demonstrations, perhaps)
- Monitoring of high traffic areas
- Assist with staffing and resource allocation.
Can you think of other use cases? Let me know in the comment section below!! We can connect and try to figure out how we can use crowd counting techniques on your stage..
Understanding of different computer vision techniques for crowd counting
In general terms, there are currently four methods we can use to count the number of people in a crowd:
1. Detection-based methods
Here, we use a moving window-like detector to identify people in an image and count how many there are. The methods used for detection require well-trained classifiers that can extract low-level characteristics. Although these methods work well for detecting faces, do not work well in crowded images, since most of the target objects are not clearly visible.
2. Regression-based methods
We were unable to extract low-level features with the above approach. Regression-based methods triumph here. First we cut out the patches from the image and then, for each patch, we extract the low-level characteristics.
3. Methods based on density estimation
First we create a density map for the objects. Later, the algorithm learns a linear mapping between the extracted features and their object density maps. We can also use random forest regression to learn nonlinear mapping.
4. CNN-based methods
Ah, good and reliable convolutional neural networks (CNN). Instead of looking at the patches of an image, we create an end-to-end regression method using CNN. This takes the whole image as input and directly outputs the people count. CNNs work great with regression or classification tasks, and they have also proven their worth in the generation of density maps.
CSRNet, a technique that we will implement in this article, implements deeper CNN to capture high-level features and generate high-quality density maps without expanding network complexity. Let's understand what CSRNet is before moving on to the coding section.
Understanding the CSRNet architecture and training method
CSRNet uses VGG-16 as an interface due to its high transfer learning capabilities. VGG output size is one fifth of original input size. CSRNet also uses dilated convolutional layers on the back.
But, What the hell are dilated convolutions? It's a fair question. Consider the following image:
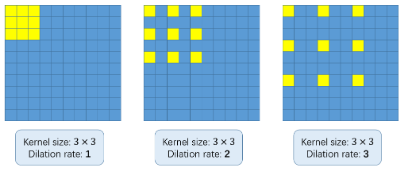
The basic concept of using dilated convolutions is to enlarge the kernel without increasing the parametersThe "parameters" are variables or criteria that are used to define, measure or evaluate a phenomenon or system. In various fields such as statistics, Computer Science and Scientific Research, Parameters are critical to establishing norms and standards that guide data analysis and interpretation. Their proper selection and handling are crucial to obtain accurate and relevant results in any study or project..... Then, if the rate of dilation is 1, we take the kernel and convert it into the whole image. While, if we increase the rate of dilation to 2, the core extends as shown in the picture above (follow the labels under each image). Can be an alternative to layer grouping.
Underlying mathematics (recommended, but optional)
I'm going to take a moment to explain how math works. Note that this is not mandatory to implement the algorithm in Python, but I recommend that you learn the underlying idea. This will come in handy when you need to adjust or modify your model..
Suppose we have an input x (m, n), a filter w (i, j) and the rate of dilation r. The output and (m, n) it will be:
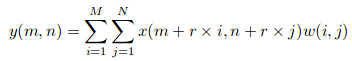
We can generalize this equation using a kernel (k * k) with a rate of dilation r. The nucleus enlarges to:
([k + (k-1)*(r-1)] * [k + (k-1)*(r-1)])
So the basic truth has been generated for each image. Each person's head in a given image is blurred using a Gaussian kernel. All images are cropped at 9 patches and the size of each patch is a quarter of the original image size. With me until now?
The first 4 patches are divided into 4 rooms and the others 5 patches are cut out randomly. Finally, The mirror of each patch is taken to duplicate the set of trainingTraining is a systematic process designed to improve skills, physical knowledge or abilities. It is applied in various areas, like sport, Education and professional development. An effective training program includes goal planning, regular practice and evaluation of progress. Adaptation to individual needs and motivation are key factors in achieving successful and sustainable results in any discipline.....
That, in a nutshell, are the details of the architecture behind CSRNet. Then, we will see your training details, including evaluation metric used.
The decline of gradientGradient is a term used in various fields, such as mathematics and computer science, to describe a continuous variation of values. In mathematics, refers to the rate of change of a function, while in graphic design, Applies to color transition. This concept is essential to understand phenomena such as optimization in algorithms and visual representation of data, allowing a better interpretation and analysis in... Stochastic is used to train CSRNet as an end-to-end structure. During the training, the fixed learning rate is set to 1e-6. The Loss functionThe loss function is a fundamental tool in machine learning that quantifies the discrepancy between model predictions and actual values. Its goal is to guide the training process by minimizing this difference, thus allowing the model to learn more effectively. There are different types of loss functions, such as mean square error and cross-entropy, each one suitable for different tasks and... It is taken as the Euclidean distance to measure the difference between the truth of the terrain and the estimated density map. This is represented as:
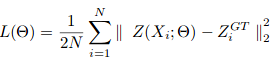
where N is the size of the training batch. The evaluation metric used in CSRNet is MAE and MSE, namely, mean absolute error and mean square error. These are given by:
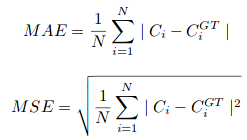
Here, Ci is the estimated count:
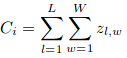
L and W are the width of the predicted density map.
Our model will first predict the density map for a given image. The pixel value will be 0 if there is no person present. A certain preset value will be assigned if that pixel corresponds to a person. Then, calculating the total pixel values corresponding to a person will give us the count of people in that image. Impressive, truth?
And now, ladies and gentlemen, It's time to finally build our own crowd counting model!!
Building your own crowd counting model
Ready with your laptop on?
We will implement CSRNet in the ShanghaiTech dataset. This contains 1198 annotated images from a combined total of 330,165 people. You can download the dataset from here.
Use the following code block to clone the CSRNet-pytorch repository. Contains all the code to create the dataset, train the model and validate the results:
git clone https://github.com/leeyeehoo/CSRNet-pytorch.git
Please install MIRACLES Y PyTorch before continuing. These are the backbone behind the code that we will use next.
Now, move the dataset to the repository you cloned earlier and unzip it. Later, we will need to create the basic truth values. the make_dataset.ipynb file is our savior. We only need to make minor changes to that notebook:
#setting the root to the Shanghai dataseta "dataset" or dataset is a structured collection of information, which can be used for statistical analysis, Machine learning or research. Datasets can include numerical variables, categorical or textual, and their quality is crucial for reliable results. Its use extends to various disciplines, such as medicine, economics and social science, facilitating informed decision-making and the development of predictive models.... you have downloaded
# change the root path as per your location of dataset
root="/home/pulkit/CSRNet-pytorch/"
Now, let's generate the basic real values for the images in part_A and part_B:
Generating the density map for each image is a time step. So make a cup of coffee while the code runs.
Up to now, we have generated the basic truth values for the images in part_A. We will do the same with the images part_B. But before that, Let's look at a sample image and plot its heat mapa "heat map" is a graphical representation that uses colors to show the density of data in a specific area. Commonly used in data analytics, Marketing and behavioral studies, This type of visualization allows you to identify patterns and trends quickly. Through chromatic variations, Heat maps make it easier to interpret large volumes of information, helping to make informed decisions.... real from the ground:
plt.imshow(Image.open(img_paths[0]))
Things are getting interesting!
gt_file = h5py.File(img_paths[0].replace('.jpg','.h5').replace('images','ground-truth'),'r')
groundtruth = np.asarray(gt_file['density'])
plt.imshow(groundtruth,cmap=CM.jet)
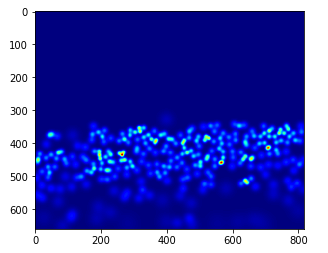
Let's count how many people are present in this image:
np.sum(groundtruth)
270.32568
In the same way, we will generate values for part_B:
Now, we have the images, as well as their corresponding fundamental truth values. Time to train our model!
We will use the .json files available in the cloned directory. We just need to change the location of the images in the files jsonJSON, o JavaScript Object Notation, It is a lightweight data exchange format that is easy for humans to read and write, and easy for machines to analyze and generate. It is commonly used in web applications to send and receive information between a server and a client. Its structure is based on key-value pairs, making it versatile and widely adopted in software development... To do this, open the .json file and replace current location with the location where your images are.
Please note that all this code is written in Python 2. Make the following changes if you are using any other version of Python:
- In model.py, change xrange on the line 18 a range
- Change the line 19 in model.py with: list (self.frontend.state_dict (). Items ())[i][1].data[:] = list (mod.state_dict (). items ())[i][1].data[:]
- In image.py, reemplace ground_truth con ground-truth
Did you make the changes? Now, open a new terminal window and type the following commands:
cd CSRNet-pytorch
python train.py part_A_train.json part_A_val.json 0 0
Again, sit down cause this will take some time. You can reduce the number of epochs in the train.py file to speed up the process. A good alternative option is to download the pre-trained weights. from here if you don't feel like waiting.
Finally, let's verify the performance of our model on invisible data. We will use the val.ipynb file to validate the results. Remember to change the path to the previously trained weights and images.
#defining the image path
img_paths = []
for path in path_sets:
    for img_path in glob.glob(os.path.join(path, '*.jpg')):
       img_paths.append(img_path)
model = CSRNet()
#defining the model
model = model.cuda()
#loading the trained weights
checkpoint = torch.load('part_A/0model_best.pth.tar')
model.load_state_dict(checkpoint['state_dict'])
Check the MAE (mean absolute error) in the test images to evaluate our model:
We have an MAE value of 75,69, which is pretty good. Now let's review the predictions in a single image:
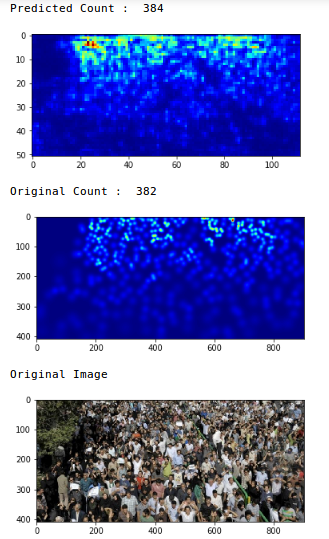 Wow, the original count was 382 and our model estimated that there was 384 people in the picture. That is a very impressive performance!!
Congratulations on building your own crowd counting model!!
Final notes
I encourage you to try this approach on different images and share your results in the comment section below.. Crowd counting has many diverse applications and is already being adopted by organizations and government agencies..
It's a useful skill to add to your portfolio. A large number of industries will be looking for data scientists who can work with crowd counting algorithms. Learn, experiment with it and give yourself the gift of deep learning!
Did you find this article useful? Feel free to leave me your suggestions and comments below, and I will be happy to communicate with you.
You should also check out the resources below to learn and explore the wonderful world of computer vision.: