One of the best practices that I follow when preparing any report / panel is to provide a lot of context. As usual, this makes a dashboard much more meaningful and action-oriented. For instance, if you only provide the number of units sold by a product line in a month, it's good information, but it is not actionable. If you add a comparison with the same month last year, last month or the average of relevant product lines in this month, has added context to the number. The business user can take more meaningful actions from this report / panel.
QlikView has a function called SET ANALYSIS that provides us with a way to add this context. Set analysis predefines the DATA SET used by our charts / boards. Then, using a set expression, we can tell our object (graphic / table) displaying values for multiple data sets (for instance, a predefined period of time, geographic region, product lines, etc.). All the examples I mentioned above as part of adding context can be achieved using Set Analysis in Qlikview.
Most QlikView professionals think that SET ANALYSIS is a complex function. Through this post, I'm trying to change your conviction about it.
What is SET ANALYSIS?
Set analysis can be understood by a simple analogy of how Qlikview works. We make selections on certain variables and the changes are reflected throughout the application. This happens because through our selection, we have created a dataset that we want to use. Similarly, using the set analysis function, we can predefine the data that will be displayed in our charts.
Some characteristics and characteristics of set analysis are:
- Used to create a different selection compared to the selections in the current application.
- Must be used in aggregation function (sum, count….).
- The expression always begins and ends with braces {}
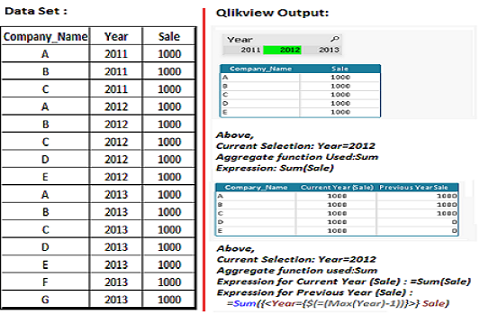
Data set example:
The SET ANALYSIS syntax is divided into three components:
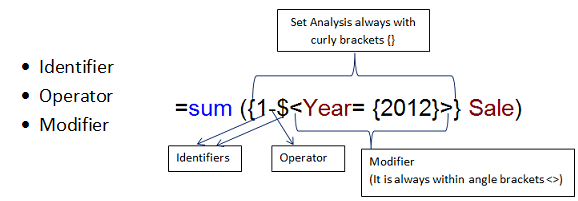
Identifiers:
|
identifier |
Description |
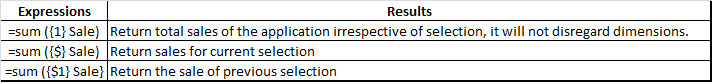
| 0 | : Represents an empty set, no records |
| 1 | : Represents the set of all records in the application. |
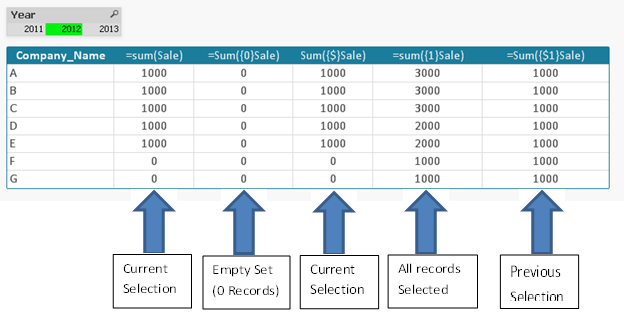
| PS | : Represents the records of the current selection. |
| $ 1 | : Represents the previous selection |
| Bookrmark01 | : Represents the set of all records against marker ID or marker name |
Examples:–
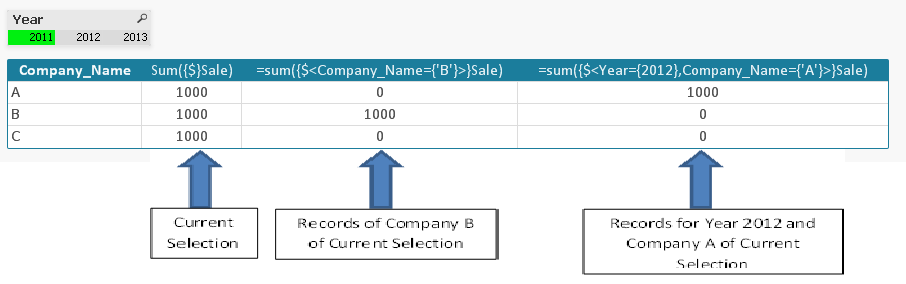
In the following example, the current year selection is 2012 and the previous selection was 2013.
Operators :
- Works on set identifiers
|
Operator |
Name of the operator |
Description |
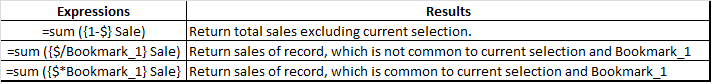
| + | Union | Returns a set of records that belongs to the union of sets. |
| – | Exclusion | Returns records that belong to the first but not the second |
| * | Intersection | Returns records that belong to both set identifiers. |
| / | Symmetric difference | Returns a set that belongs to one of the two identifiers, but not both. |
Examples:–
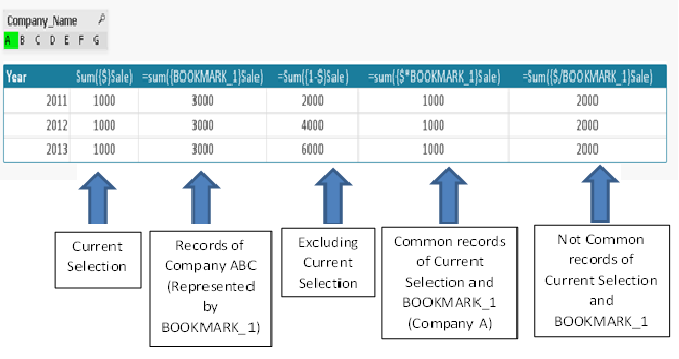
In the following example, I have created a bookmark “BOOKMARK_1” for the selection of company A, B y C.
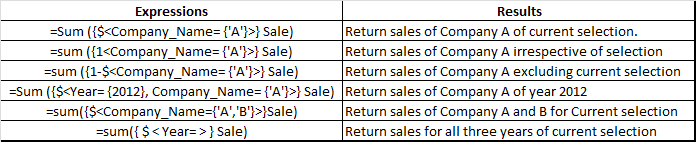
Modifiers:
- Modifiers are always in angle brackets .
- It consists of several fields and all fields have selection criteria.
- Condition of fields within modifiers ignores current selection criteria.
Dollar sign expansion:
If we want to compare the sale of the current year with the previous year, previous year's sales should reflect values relative to current year's selection. For instance, if the current year selection is 2012, the previous year should be 2011 and for the current selection of the year 2013, the previous year is 2012.
“=Sum ({$<Year = {$ (=Max (Year)-1)} >} Sale) “
The above expression always returns the sale of the previous year. The sign is used here $ (red font color) to assess the value of the previous year. The sign $ used to evaluate expressions and use variables in set modifiers. If we have a variable that has the value of last year (vLASTYEAR) then the expression can be written as:
“=Sum ({$vLASTYEAR)} >} Sale) “

  Indirect SET ANALYSIS: Function P() and E()
Let's take a scenario where we want to show the current sales of the companies that had sales last year.
The expression should be similar to:
=sum({$<Year={$(=Max(Year))},Company_Name={Companies who had sales last year}> } Sale)
First we have to identify the companies that had sales last year. To solve this problem, we will use the P function () which is used to identify values within a field and the E function () which excludes values within a field.
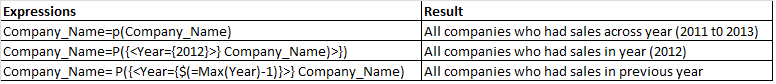
Finally, we have the expression:
=sum({<Year={$(=Max(Year))},Company_Name=P({<Year={$(=Max(Year)-1)}>}Company_Name)>}Sale)
This post was an example where we have introduced methods to use SET ANALYSIS in Qlikview. Have you used this feature before? If so, Was it useful to you? Have any more nifty tricks to make ensemble analysis more interesting?? If that is not the case, Do you think this article will allow you to use Set Analysis in your next dashboard?
Let me know what you think about using this function in QlikView.


