Overview
- Learn how to create an accurate forecast in Excel, a classic technique for any analytics professional.
- We will work on a real world case study to design and forecast sales in Microsoft Excel.
Introduction
I first came across the term prognosis, in the real world business sense, on the popular TV show 'Shark Tank'. The enigmatic Mr. Wonderful always asked: “What is your sales forecast for this year?” It's such a simple question that, but nevertheless, started a conversation about the whole business model, the frame, suitability, etc.

Given the scalable nature of business these days, I used to wonder how the hell these guys are forecasting their sales figures. For someone who was not yet familiar with forecasts, this was an intriguing topic.
And let's face it: Forecasting is at the core of what we do in analytics and / or data science. As Shark Tank alludes throughout the show, if you are unable to forecast for your business / product / service, will face problems, friends.
Forecast is everywhere: sales, marketing, operations, finance, etc. Analytics professionals are at the forefront of forecasting design, A significant advantage!

Here is the question: Microsoft Excel is one of the most versatile and easily accessible tools for making these business forecasts. Any, from analysts and managers to executives and investors, you can harness the power of Excel to create these business forecasts.
I love this! Excel brings the predictive power of forecasting to everyone without any knowledge of statistics and programming. Then, Why not learn how to create forecasts in Excel yourself?
In this article, we will work on a very interesting case study of a local candy store. We will forecast sales for the remaining months of 2020 and we will also see the effect of the coronavirus on our forecast.
If you are a beginner in the world of data science and analytics, I would recommend these free courses to get started:
Table of Contents
- What is forecast?
- Why is forecasting important to an analyst?
- Important functions to know before forecasting in Excel
- Forecast in Excel: Let's get going!
What is forecast?
The million dollar question (sometimes literally): What is the world forecasting?
In simpler terms, is the process of predicting the future while analyzing past and present data. We perform quantitative forecasts primarily on time series data. Then, Let's understand some key time series terms before we move on..
Time series is generally data that is collected over time and is dependent on the time component. For instance, here we have a series of data on the number of passengers that fly each year:
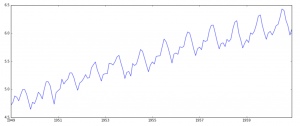
Some of the large time series that I have seen consist of some component, and it's really important to get over them once we get started:
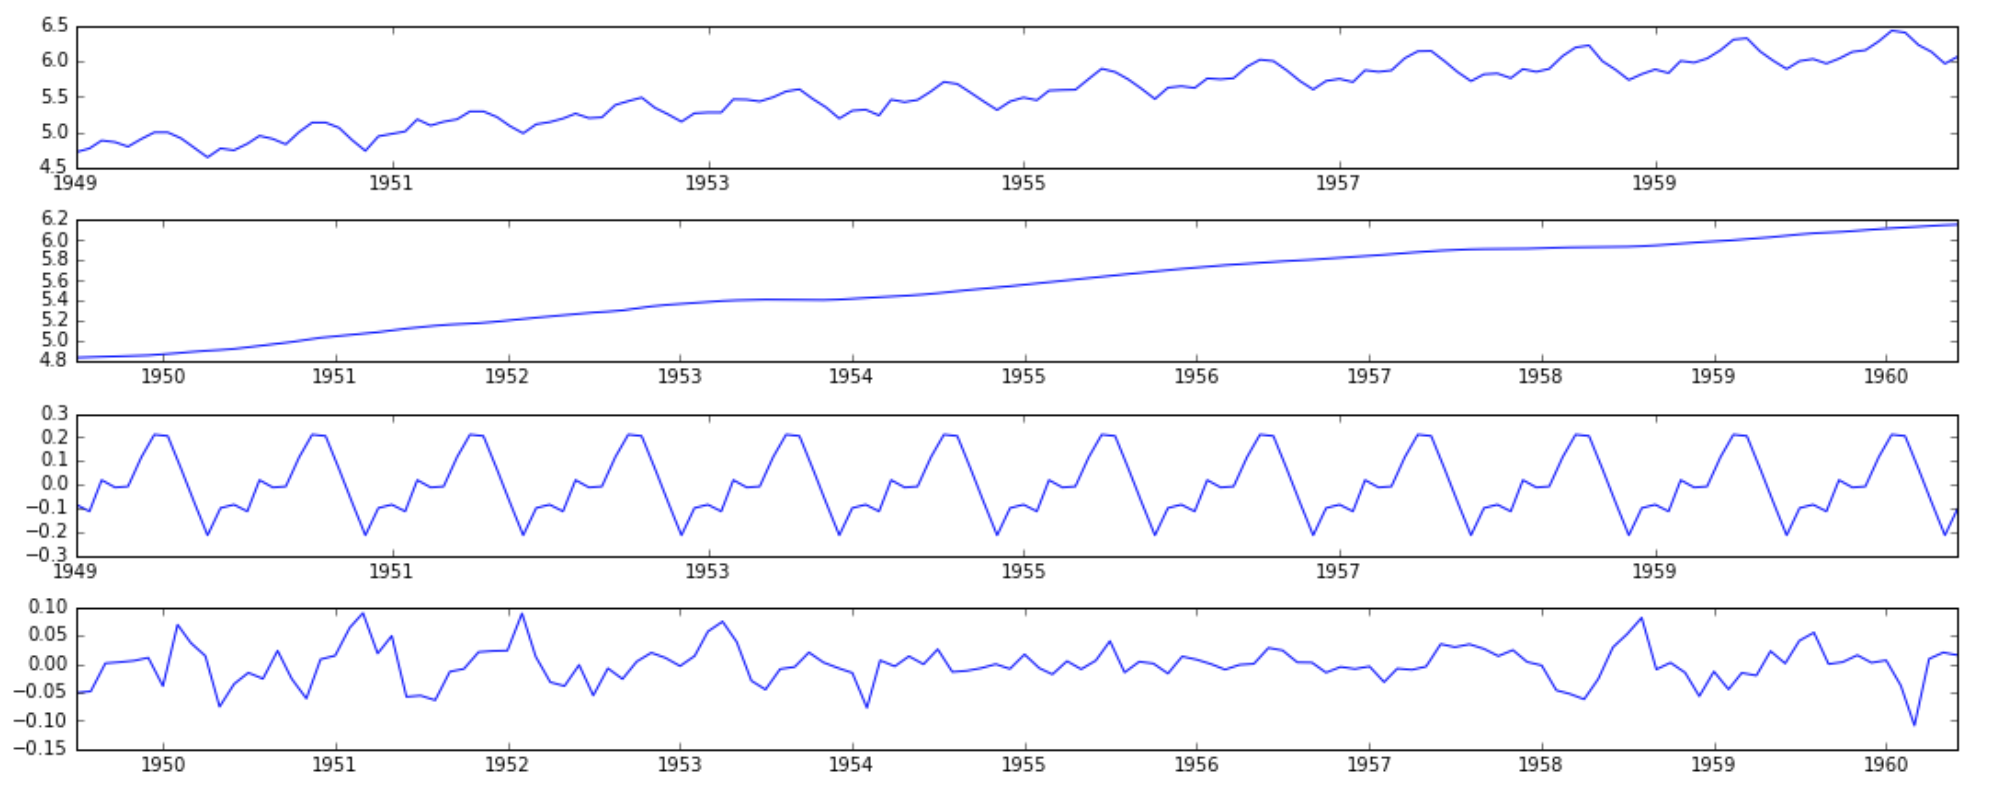
- Trend – Trend is a general direction in which something is developing or changing. In the example above, we see an increasing trend in the time series, which means that the number of passengers flying on airplanes is increasing. The second visualization represents the trend in the image below.
- Seasonality – Another clear pattern that can be seen in the time series above is that the pattern repeats itself in a regular time interval.. This is known as seasonality.. Any predictable change or pattern in a time series that repeats or repeats over a specific time interval can be said to be seasonality.. The third visualization represents the seasonal component.
The last display shows the noise or error in the time series.
Why is forecasting important to an analyst?
- Business managers use forecasting to predict sales and, Consequently, plan your budgets, hiring plans, etc.
- Economists can use forecasting to predict future recessions, economic ups and downs and, Consequently, recommend a future plan.
- Governments use forecasting to plan and develop their policies
Here are some examples where forecasting is used in everyday life. If you plan to become a business analyst, it is recommended that you improve your forecasting skills.
To make forecasts for the scope of this tutorial, you will not need any prior knowledge of statistics or programming. We will use the most used analysis tools: Microsoft Excel.
If you want to drill down into time series data, this article is for you:
Important functions to know before forecasting in Excel
We will start with the simplest function available in Excel:
Forecast.linear ()
Predict or calculate values using existing or past values. We would predict Y looking X values. The linear regression function calculates this.
While this function works best if there is a linear trend in your data, namely, y depends linearly on the values of x, there is a warning. This function will not give a good idea if there is seasonality (read the definition above) here I'm.
Do not worry, Excel offers us another great function for advanced forecasting:
Forecast.ets ()
This function predicts values using existing values, namely, historical values. Make this prediction using the triple exponential smoothing method.. While I will not delve into the method, I will mention some points that you should know:
- The Forecast.ets function or the triple exponential smoothing method takes seasonality into account
- This method is a weighted method and the weight of the past value decreases exponentially, which means the older the value, less is its importance.
- Most importantly, the timeline should be spread evenly or, on the contrary, will give an error. For instance, can be monthly data, daily data, annual data, etc.
- Excel is great to start your forecasting journey, as it automates many things like detecting the seasonality cycle. You can manually enter seasonality and other inputs, but only do it if you know the forecasts and the business very well.
Forecasting.ets.seasonality ()
Returns the number of seasonal patterns that Excel detects on the timeline.
Forecasting.ets.confint ()
Returns a confidence interval for the predicted value at the specified target date. The default confidence interval is 95%. This means that the 95% of future values will be in this value range. It can be overwhelming to understand all the features, so let's start practically working on a case study.
Build your forecasting model in Excel
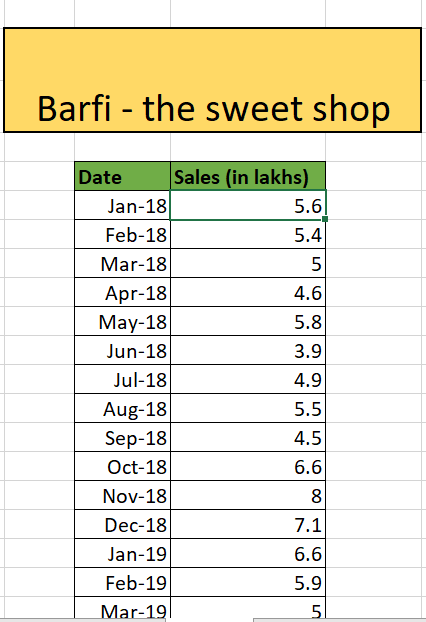
Let's start with the most anticipated section of the article. We have a data set from a local candy store: barfi. It consists of monthly sales data for your products as of January 2018 until August 2020. We will forecast Barfi sales for the remaining months of the year so that the store owner can prepare his inventory and staff accordingly..
Here is the sample data:
We will predict the value of sales during 4 months: September, October, November and dicember:
We'll start with the forecasting steps for versions of Excel prior to 2016.
Forecast in Excel prior to 2016
In versions of Excel earlier than 2016, we will apply our gold forecast function always:
You can check the seasonality and confidence interval using the function.
Forecast in Excel 2016 onwards
Make forecasts in Excel versions 2016 and later can be much more intuitive and fun. We will perform the steps using the forecast sheet.
Paso 1: select forecast sheet
Go to Data and select Forecast Sheet:
Paso 2: select the necessary options
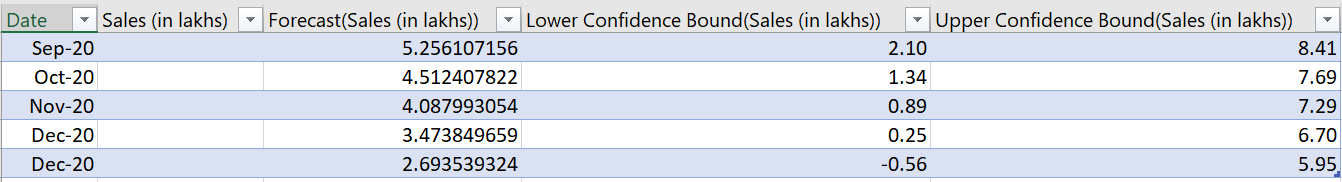
Later, you can select the necessary options like: finish date, confidence interval and make many more customizations. The forecast sheet provides us with tabular values as forecast, lower confidence value and upper confidence value along with a graphical view of the data:
Congratulations! You have made your first forecast model in Excel!! It is simple, ¿no?
Let's discuss the result of our analysis:
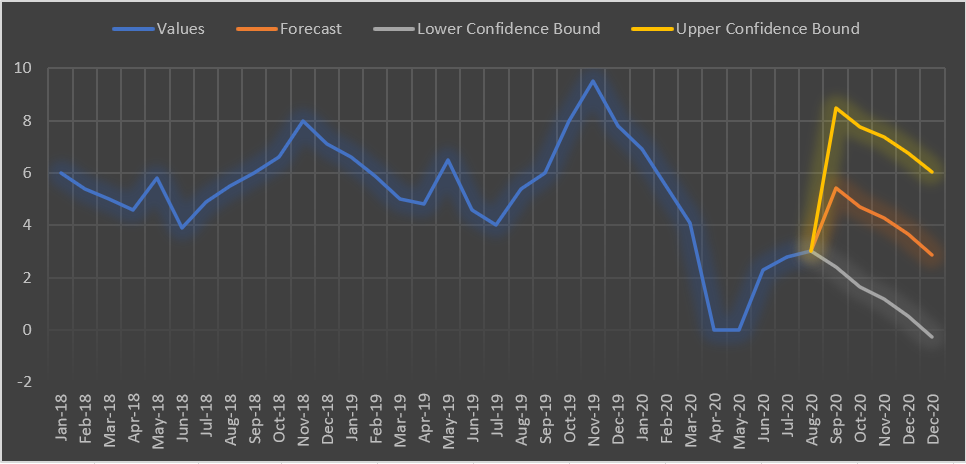
By looking at our data, we notice that there are usually peaks in the month of November and the neighboring months probably due to the festive seasons.
Arriving in April and May, the store had no income! That's hard. Sales have recovered in the following months of July and August.
Our forecast suggests that this trend will grow in September with a sale value of 5.4 lakhs. The store can now view forecast data for the next few months to prepare its inventory. They can also look at confidence levels and get an idea of what fluctuation might look like..
Final notes
Wow, we cover a lot of ground in this article. We understood the importance of forecasting and how we can build a forecasting model in Excel.
I hope everyone found it useful and applied this amazing technique to their corporate life. (And to your daily personal affairs!).
There is a lot of difference between the data science we learn in courses and personal practice and the one we work with in industry. I highly recommend that you follow these crystal clear free courses to understand all about analytics, machine learning and artificial intelligence:
- Introduction to the free AI course / ML | Mobile app
- Introduction to the AI mobile app / ML for business leaders
- Free introductory business analysis course | Mobile app
Let me know where we can apply forecasting techniques in other trading scenarios in the comment section below.


