Introduction
The article aims to empower you to create your projects by learning how to create your data frame and collect data about the stock market and internet crypto market and then base your code on it.. This will allow you to create your ML models and experiment with real world data..
In this article, I will demonstrate two methods and both use Yahoo Finance as data source, as it is free and no registration is required. You can use any other data source like Quandi, Tiingo, IEX Cloud and more.
Getting ready
In the first approach, we will consider the finance module in Python and it is a very easy module to work with. The other module we will talk about is yahoofinancials, which requires extra effort but returns a lot of extra information in return. We will discuss that later and now we will start by importing the required modules in our code.
Initial setup:
We need to load the following libraries:
import pandas as pd
import yfinance as yf
from yahoofinancials import YahooFinancials
If you don't have these libraries, you can install them via pip.
!pip install yfinance
!pip install yahoofinancials
First method: how to use yfinance
It was previously known as ‘fix_yahoo_finance’, but then it became its own module, but yahoo is not official. The 'yfinance module’ it is now a very popular library that is highly compatible with Python and can be used as a patch for pandas_datareader or a standalone library on its own. It has many potential uses and many people use it to download stock prices and also cryptocurrency prices. Without forther delay, let's run the following code. We will start by downloading the share price of ‘Apple’
Code:
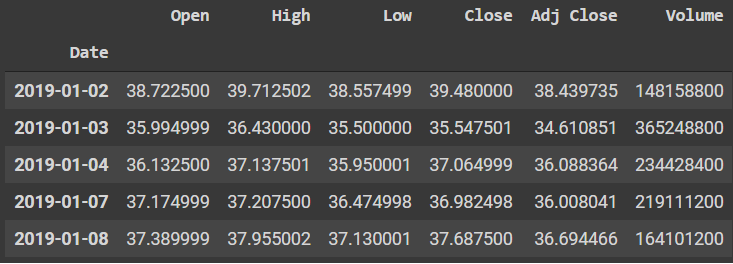
aapl_df = yf.download('AAPL',
                      start="2019-01-01",
                      end='2021-06-12',
                      progress=False,
)
aapl_df.head()
Production :
The data range is set to 1 day, but the inner can be specified externally with values like 1 m, 5 m, 15 m, 30 m, 60 m, 1h, 1d, 1 week, 1 month and more. The above command to download the data shows a start and end date, but you can also just download the data with the code given below:
Code:
aapl_df = yf.download('AAPL')
Production :

There are many parameters of the download function that you can find in the documentation and the start and end are some of the most common to be used. Since the data was small, the progress bar was set to false and showing that it is pointless and should be used for large volumes or data.
We can also download multiple share prices of more than one asset at the same time. Providing a list of company names in list format (p. Not. [‘FB’,’ MSFT’,‘AAPL’] ) as the tickers argument. We can also provide an additional argument which is autotuning = True, so that all current prices are adjusted for possible corporate actions such as divisions.
In addition to the yf.download function, we can also use the ticker module and you can run the following code to download the latest 5 years of Apple stock prices.
Code:
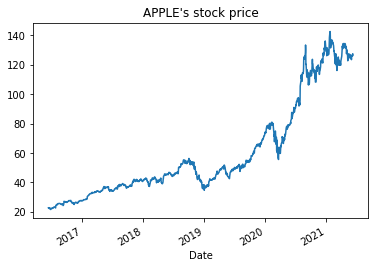
ticker = yf.Ticker('AAPL')
aapl_df = ticker.history(period="5Y")
aapl_df['Close'].plot(title="APPLE's stock price")
Production :
The only advantage of using a ticker module is that you can take advantage of the multiple methods that are connected to it.. The available methods that we can use are:
-
info – This method prints a JSON formatter output that contains a lot of information about the company, starting with the full name of the company, the summary, the industry, the exchanges listed with the country and time zone, and more. It also comes equipped with the beta coefficient.
-
recommendations – This method contains a historical list of recommendations made by different analysts regarding the stock and whether to buy., sell or give suggestions about it.
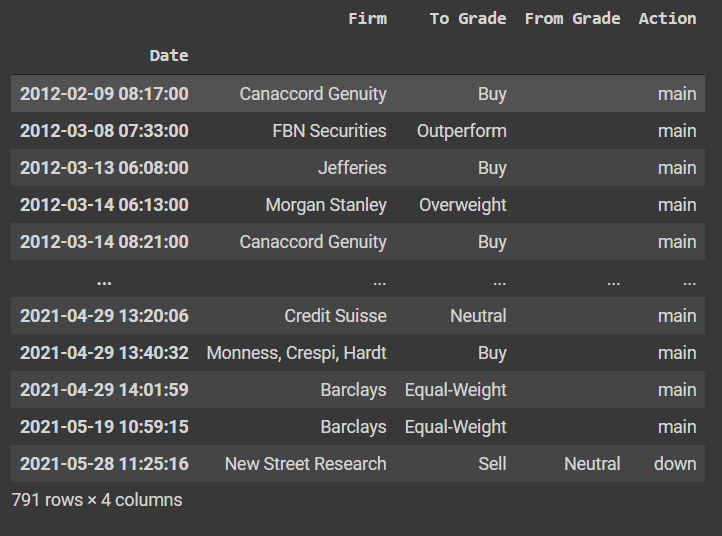
-
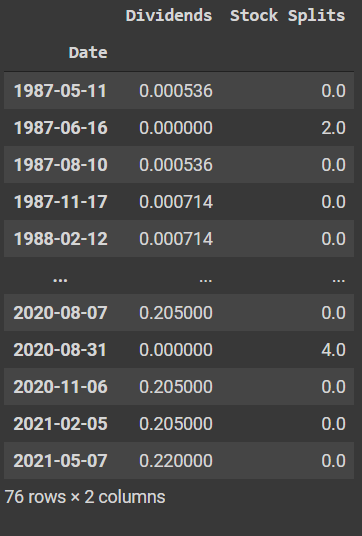
calendar – This function shows all incoming events, like earnings, and you can even add this to your google calendar via code. Basically, shows important dividend dates for a company.
If you still want to explore more about how the functions work, you can check this GitHub yfinance repository.
Second method: How to use yahoofinancials?
The second method is to use the yahoofinancials module, which is a little more difficult to work with, but it provides much more information than yfinance. We'll start by downloading Apple stock prices.
To do this, we will first pass a YahooFinancials object bypassing the Apply ticker name and then we will use a variety of important information to get the required data. Here, the data returned is in JSON format and, Thus, we do a bit of beautification so that they can be transformed into a DataFrame to display them correctly.
Code:
yahoo_financials = YahooFinancials('AAPL')
data = yahoo_financials.get_historical_price_data(start_date="2019-01-01",
                                                  end_date="2019-12-31",
                                                  time_interval="weekly")
aapl_df = pd.DataFrame(data['AAPL']['prices'])
aapl_df = aapl_df.drop('date', axis=1).set_index('formatted_date')
aapl_df.head()
Production :
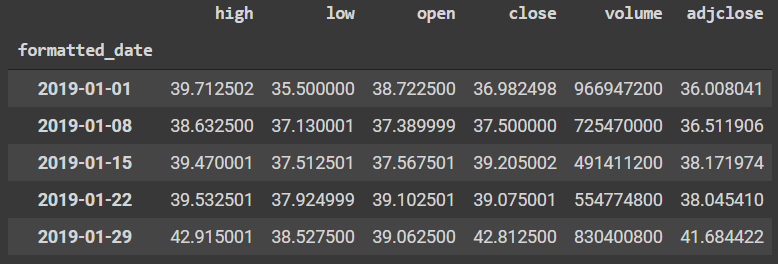
At a technical level, the process of obtaining a historical price of the shares is a bit longer than the case of yfinance, but that is mainly due to the huge volume of data. Now we move on to some of the important functions of yahoofinancials.
-
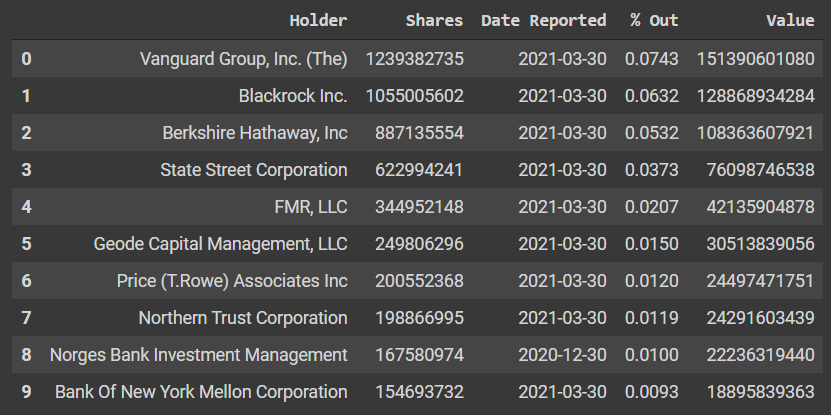
get_stock_quote_type_data () – This method returns a lot of generic information about an action that is similar to the yfinance info function (). The output is something like this.
-
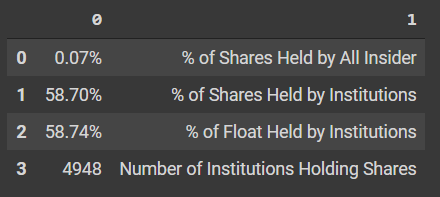
get_summary_data () – This method returns a summary of the entire company along with useful data such as the beta value, price to book value and more.
-
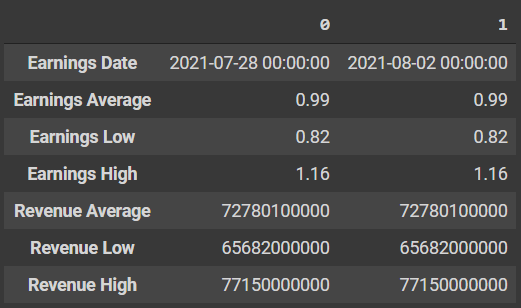
get_stock_earnings_data () – This method returns information about the company's quarterly and annual earnings along with the next date the company will report its earnings..
-
get_financial_stmts () – This is another useful method to retrieve the financial statements of a company that is useful for the analysis of a stock..
-
get_historical_price_data () – This is a method similar to the download function () o Ticker () to get stock prices with start_date, end_date and interval ranges.
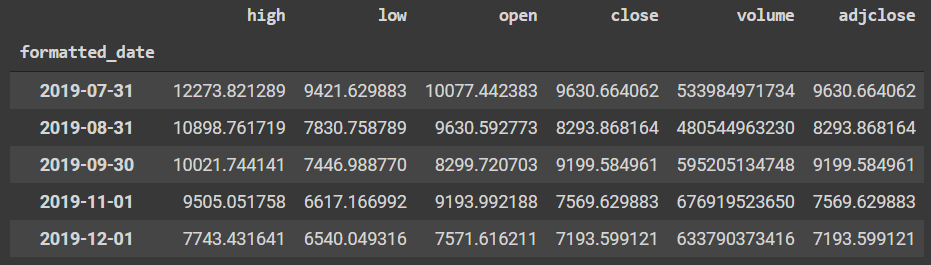
The above module can also be used to download company data at once, like yfinance and cryptocurrency data can also be downloaded as below code shown.
Code:
yahoo_financials = YahooFinancials('BTC-USD')
data=yahoo_financials.get_historical_price_data("2019-07-10", "2021-05-30", "monthly")
btc_df = pd.DataFrame(data['BTC-USD']['prices'])
btc_df = btc_df.drop('date', axis=1).set_index('formatted_date')
btc_df.head()
Production :
For more details about the module, you can check your GitHub Repository.
EndNotes
Complete information is ultimately obtained from Yahoo Finance and now you know how to import any set of stock or cryptocurrency information and price data into your code and start exploring and experimenting with it. Good luck with your adventures and feel free to share your code with me on LinkedIn or do not hesitate to contact me in case of doubts or errors.
Thanks for reading to the end. I hope you are well and that you stay safe and that you get vaccinated soon or that you are already.
About the Author :
Arnab Mondal
Data Engineer and Python Developer | Freelance technical writer
Link to my other articles


