
This article was published as part of the Data Science Blogathon
Introduction
In Data science, our goal is to run different experiments with raw data and find some good insights from the data. To drive any business on the right path, the data is very important or we can say that “Data is the fuel”. You can at least provide useful information that can help:
- Current campaign strategies,
- Easily organize new product launches or
- Try different experiments.
In all the things mentioned above, the only common driving component is data. We are entering the digital age where we produce a large amount of data every day.
For instance, Daily, a company like Flipkart produces more than 2 Data TB.
Due to the great importance of data in our life, it becomes very important to correctly store and process this data without any errors. When dealing with data sets, the type of data or the category of the data plays an important role in finding the answer to the following questions:
- What preprocessing strategy would work for a particular set to get the correct results, O
- What type of statistical analysis should be applied to obtain the best results.
Then, in this article, we will discuss the different types of data in statistics you need to know to do Exploratory data analysis (EDA), which is one of the most important components in the pipeline of a machine learning project.
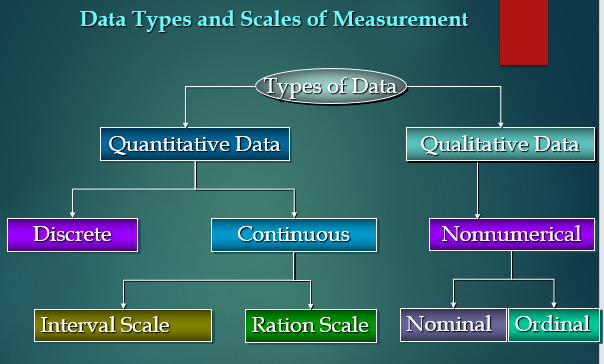
Image source: Google images
Table of Contents
1. Introduction to data types in statistics and their importance
2. Qualitative vs quantitative data
3. Qualitative data
- Nominal data
- Ordinal data
4. Quantitative data
- Discrete data
- Continuous data
- Interval data
- Relationship data
Introduction to data types in statistics
In statistics, data types play a very crucial and important role, what should be understood, to apply statistical measurements correctly to your data so that we can correctly conclude certain assumptions about the data.
Similarly, we need to know which data analysis and its type you are working on to select the correct perception technique, since different types of data are considered as an approach to organize various types of variables.
While doing Exploratory data analysis (EDA) In a general data science project, a good understanding of the different types of data is crucial, since we can use certain statistical measures only for specific data types.
It is also known as the Measurement scale.
When dealing with any of the data types, we also need to know which display method fits the particular data type.
We can think of data types as a way to categorize different types of variables.
Quantitative vs qualitative data
Quantitative data
1. These types of data seem to be the easiest to explain. Try to find the answers to questions like
- “Many,
- “How many” Y
- “How often”
2. Can be expressed as a number, so it can be quantified. In simple words, can be measured by numerical variables.
3. These are easily opened for statistical manipulation and can be represented by a wide variety of statistical types of graphs and tables such as line charts, bar graphs, scatter plotA scatter plot is a visual representation that shows the relationship between two numerical variables using points on a Cartesian plane. Each axis represents a variable, and the location of each point indicates its value in relation to both. This type of chart is useful for identifying patterns, Correlations and trends in the data, facilitating the analysis and interpretation of quantitative relationships....etc.
Examples of quantitative data:
- Test and Exam Scores, p. Not. 74, 67, 98, etc.
- The weight of a person.
- The temperature in a room.
There is 2 general types of quantitative data:
- Discrete data
- Continuous data
Qualitative data
1. Qualitative data cannot be expressed as a number, so they cannot be measured. It consists mainly of words, images and symbols, but not numbers.
2. It is also known as Categorical data since the information can be sorted by category, not by number.
3. These can answer questions like:
- “How has this happened”, O
- "Why has this happened".
Qualitative data examples:
- Colors, for instance, the color of the sea.
- Popular vacation destinations like Switzerland, New Zealand, South Africa, etc.
- Ethnicity as American Indian, Asian, etc.
In general, exist 2 qualitative data types:
- Nominal data
- Ordinal data.
Qualitative data
Nominal data
1. This data type is used only to label variables, without having any quantitative value. Here, the term 'nominal’ comes from the latin word “no man” meaning 'Name’.
2. Just name one thing without asking for any particular order. Nominal data sometimes referred to as “labels”.
Nominal data examples:
- Gender (women, mens)
- Hair color (rubio, Chestnut, moreno, Red, etc.)
- Marital status (married, single, widower)
As you can see in the examples, there is no intrinsic order for the variables.
Eye color is a variableIn statistics and mathematics, a "variable" is a symbol that represents a value that can change or vary. There are different types of variables, and qualitative, that describe non-numerical characteristics, and quantitative, representing numerical quantities. Variables are fundamental in experiments and studies, since they allow the analysis of relationships and patterns between different elements, facilitating the understanding of complex phenomena.... that has a few levels or categories such as Blue, Verde, Brown, etc. and there is no possible way to order these categories hierarchically, namely, from highest to lowest or vice versa.
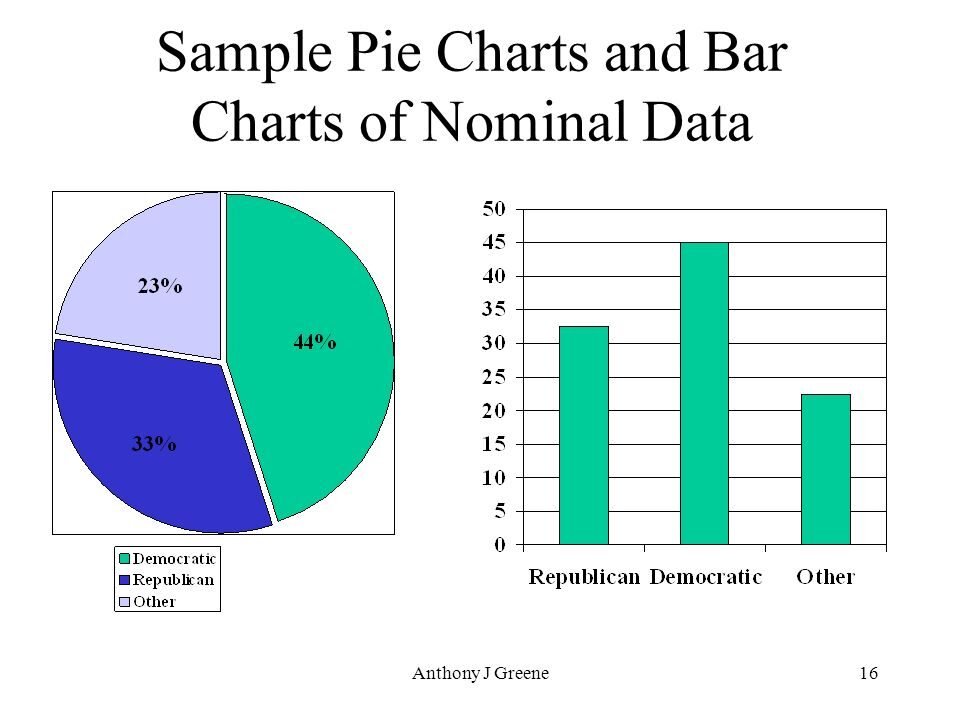
Image source: Google images
Ordinal data
1. The crucial difference with nominal data types is that Ordinal Data shows where a number is present in a particular order.
2. This type of data is placed in some kind of order based on its position on a scale. Ordinal data may indicate superiority.
3. We cannot do arithmetic operations with ordinal data because they only show the sequence.
4. Ordinal variables are considered qualitative and quantitative "intermediate" variables..
5. In simple words, we can understand ordinal data as qualitative data for which the values are ordered.
6. Compared to nominal data, the second is qualitative data whose values cannot be placed in an order.
7. According to the relative position, we can also assign numbers to ordinal data. But we can't do math with those numbers. For instance, “First, second, third … etc.”
Examples of ordinal data:
- Ranking of users in a competition: First, second and third, etc.
- Qualification of a product taken by the company on a scale of 1 al 10.
- Economic situation: baja, medium and high.
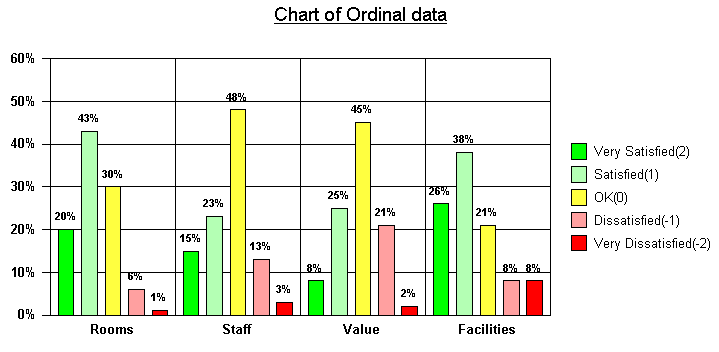
Image source: Google images
Quantitative data
Discrete data
1. Returns the count involving only whole numbers and we cannot subdivide the discrete values into parts.
For instance, the number of students in a class is an example of discrete data, since we can count complete individuals but we cannot count as 2.5, 3.75, kids.
2. In simple words, discrete data can take only certain values and data variables cannot be divided into smaller parts.
3. Has a limited number of possible values for instance, days of the month.
Discrete data examples:
- The number of students in a class.
- The number of workers in a company.
- The number of test questions you answered correctly.
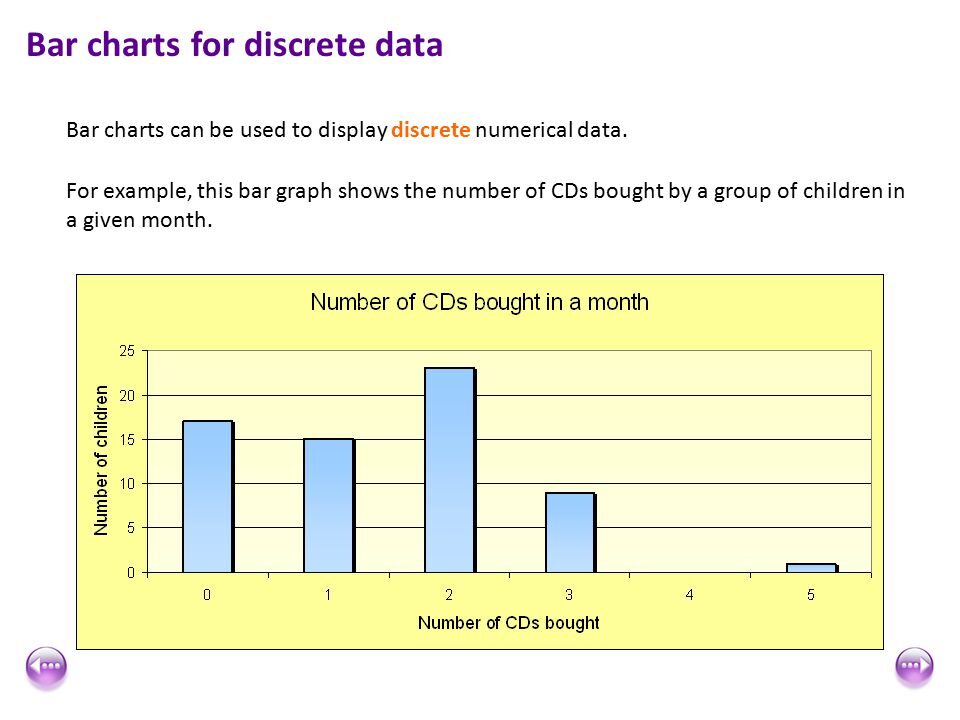
Image source: Google images
Continuous data
1. Represents information that could be broken down significantly at its finest levels. It can be measured on a scale or continuous and can have almost any numerical value.
For instance, We can measure our height at very precise scales in different units like meters, centimeters, millimeters, etc.
2. The key difference between continuous and discrete data types is that in the former, we can record continuous data in as many different measures as width, temperature, weather, etc.
3. Continuous variables can take any value between two numbers. For instance, between the range of 60 Y 82 inches, there are millions of possible heights like 62.04762 inches, 79.948376 inches, etc.
4. A good rule of thumb for defining whether the data is continuous or discrete is if the measurement point can be halved and it still makes sense, data is continuous.
Examples of continuous data:
- The amount of time required to complete a project.
- Children's height.
- Speed of cars.
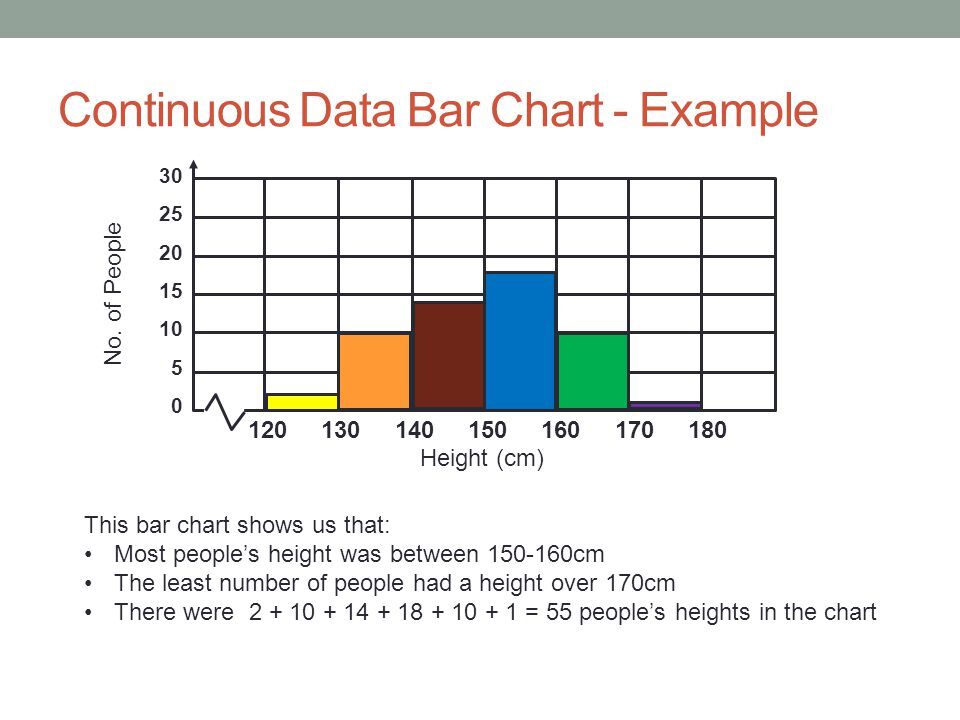 Image source: Google images
Interval data
1. These types of data can be measured and ordered with the closest elements, but they don't have a significant zero.
Let's understand the meaning of “Interval scale”:
On the interval scale, the term 'interval’ means space in the middle, which is a significant thing to remember, since interval scales not only educate us on the order, but also provide information about the value between each element.
2. Basically, we can display the interval data in the same way as the ratio data, but what we must take into account is its characterized zero points.
3. Therefore, with the help of interval data, we can easily correlate the degrees of the data and also add or subtract the values.
4. There are some descriptive statistics that we can calculate for interval data like:
- Central trend measures (media, medianThe median is a statistical measure that represents the central value of a set of ordered data. To calculate it, the data is organized from lowest to highest and the number in the middle is identified. If there are an even number of observations, the two core values are averaged. This indicator is especially useful in asymmetric distributions, since it is not affected by extreme values...., fashion)
- Rank (minimum, maximum)
- Spread (percentiles, interquartile range and standard deviation).
These are not the only statistical things to calculate, but we can also calculate more things.
Interval data examples:
- Temperature (° C o F, but not kelvin)
- Dates (1055, 1297, 1976, etc.)
- Time interval on a clock 12 hours (6 a. M., 6 p. M.)
Relationship data
1. This data is also in the ordered units that have the same difference.
2. The ratio values are the same as the interval values, but the only difference is that the ratio data has an absolute zero. For instance, height, weight, length, etc.
3. These are measured and ordered with equidistant elements with a significant zero and will never be negative like interval data.
Let's understand this with an outstanding example: Height measurement.
Height can be measured in units such as centimeters, inches, meters or feet and it is not possible to have a negative height value.
4. It enlightens us as to the order of the variables, the contrasts between them, and they have absolutely zero.
5. The ratio data is fundamentally the same as the interval data, apart from zero means none.
6. The descriptive statistics that we can calculate for the ratio data are the same as the interval data like:
- Central trend measures (media, median, fashion)
- Rank (minimum, maximum)
- Spread (percentiles, interquartile range and standard deviation).
Relationship data example:
- Age (of 0 years to 100+)
- Temperature (in Kelvin, but not in ° C or F)
- Time interval (measured with a stopwatch or similar)
For the above examples of ratio data, we see that there is a real and significant zero point like the age of a person, absolute zero, the calculated distance from a specific point or time, they all have real zeros.
NOTE:
If we choose the zero point of the scale subjectively, then at that point the data cannot be ratio data and should be interval data.
Final notes
Thank you for reading!
Hope you enjoyed the article and increased your knowledge of data types in statistics.
Please feel free to contact me about Email
Anything not mentioned or do you want to share your thoughts? Feel free to comment below and I'll get back to you.
For the remaining items, Ask the Link.
About the Author
Aashi Goyal
Nowadays, I am pursuing my Bachelor of Technology (B.Tech) in Electronic and Communication Engineering from Universidad Guru Jambheshwar (GJU), Hisar. I am very excited about statistics and data science.
The media shown in this article on data types in statistics is not the property of Analytics Vidhya and is used at the author's discretion.





