
This post was made public as part of the Data Science Blogathon.
Introduction
Have you ever dreamed of creating your own image similarity app?, pero tiene miedo de no saber lo suficiente sobre deep learningDeep learning, A subdiscipline of artificial intelligence, relies on artificial neural networks to analyze and process large volumes of data. This technique allows machines to learn patterns and perform complex tasks, such as speech recognition and computer vision. Its ability to continuously improve as more data is provided to it makes it a key tool in various industries, from health..., red neuronal convolucionalConvolutional Neural Networks (CNN) are a type of neural network architecture designed especially for data processing with a grid structure, as pictures. They use convolution layers to extract hierarchical features, which makes them especially effective in pattern recognition and classification tasks. Thanks to its ability to learn from large volumes of data, CNNs have revolutionized fields such as computer vision.. and more? Avoid worrying. The following tutorial will get you started and help you code your own Image Similarity App with basic math.
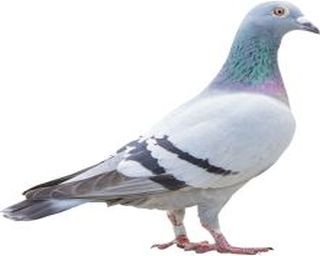
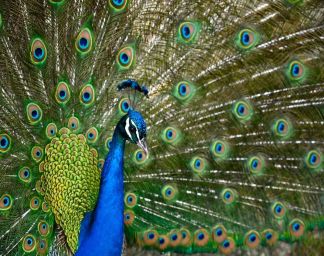
Before moving on to the math and code, I would ask you a simple question. Given two reference images and a test image, Which one do you think our test image belongs to two?
Reference image 1
Reference image 2
Test Image
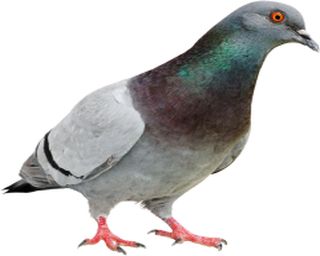
If you think our test image is similar to our first reference image, Is right. If you believe otherwise, Let's find out along with the power of math and programming.
“The future of search will focus on images instead of keywords”. – Ben Silbermann, CEO of Pinterest.
Vector image
Each image is stored in our computer in the form of numbers and a vector of such numbers that can fully describe our image is known as Image Vector.
Euclidean distance:
The Euclidean distance represents the distance between any two points in an n-dimensional space. Since we represent our images as image vectors, they are nothing more than a point in a space of n dimensions and we are going to use the Euclidean distance to find the distance between them.

Histogram:
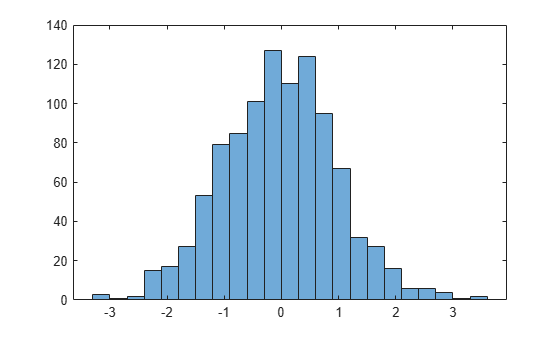
A histogram is a graphical display of numerical values. We will use the image vector for the three images and then we will find the Euclidean distance between them. Based on the returned values, the image with a smaller distance is more similar than the other.
To find the similarity between the two images, we will use the following approach:
- Read image files as an array.
- Since the image files are colored, there is 3 channels for RGB values. We are going to flatten them so that each image is a single 1-D matrix.
- Once we have our image files as an array, we are going to generate a histogram for each image where for each index 0-255 let's count the occurrence of that pixel value in the image.
- Once we have our histograms, we will use the L2 rule or the Euclidean distance to find the difference between the two histograms.
- Based on the distance between the histogram of our test image and the reference images, we can find the image to which our test image is most similar.
Coding for Image Similarity in Python
Import the dependencies that we are going to use
from PIL import Image
from collections import Counter
import numpy as np
We will use NumPy to save the image as a NumPy array, Image to read the image in terms of numerical values and Counter to count the number of times each pixel value occurs (0-255) in the pictures.
Read the picture
reference_image_1 = Image.open('Reference_image1.jpg')
reference_image_arr = np.asarray(reference_image_1)
print(np.shape(reference_image_arr))
>>> (250, 320, 3)
We can see that our image has been correctly read as a 3-D matrix. In the next step, we must flatten this 3-D matrix into a one-dimensional matrix.
flat_array_1 = array1.flatten()
print(np.shape(flat_array_1))
>>> (245760, )
We are going to do the same steps for the other two images. I'll skip it here so you can test it further.
Generating the count histogram vector:
RH1 = Counter(flat_array_1)
The next line of code returns a dictionary where the key corresponds to the pixel value and the key value is the number of times that pixel is present in the image.
A limitation of the Euclidean distance is that it needs all vectors to be normalized, In other words, both vectors must have the same dimensions. To make sure our histogram vector is normalized, we will use a loop for of 0-255 and we will generate our histogram with the key value if the key is present in the image; opposite case, we add a 0.
H1 = []
for i in range(256):
    if i in RH1.keys():
        H1.append(D1[i])
    else:
        H1.append(0)
The above code snippet generates a vector of size (256,) donde cada indexThe "Index" It is a fundamental tool in books and documents, which allows you to quickly locate the desired information. Generally, it is presented at the beginning of a work and organizes the contents in a hierarchical manner, including chapters and sections. Its correct preparation facilitates navigation and improves the understanding of the material, making it an essential resource for both students and professionals in various areas.... corresponde al valor del píxel y el valor corresponde al recuento del píxel en esa imagen.
We follow the same steps for the other two images and obtain their corresponding Count-Histogram-Vectors. In this point, we have our final vectors for both the reference images and the test image and all we will do is calculate the distances and predict.
Euclidean distance function:
def L2Norm(H1,H2):
    distance =0
    for i in range(len(H1)):
        distance += np.square(H1[i]-H2[i])
    return np.sqrt(distance)
La función anterior toma dos histogramasHistograms are graphical representations that show the distribution of a dataset. They are constructed by dividing the range of values into intervals, O "Bins", and counting how much data falls in each interval. This visualization allows you to identify patterns, trends and variability of data effectively, facilitating statistical analysis and informed decision-making in various disciplines.... y devuelve la distancia euclidiana entre ellos.
Evaluation:
Since we have everything we need to find the similarities in the image, Let's find out the distance between the test image and our first reference image.
dist_test_ref_1 = L2Norm(H1, test_H)
print("The distance between Reference_Image_1 and Test Image is : {}".format(dist_test_ref_1))
>>> The distance between Reference_Image_1 and Test Image is : 9882.175468994668
Let's now find out the distance between the test image and our second reference image.
dist_test_ref_2 = L2Norm(H2,test_H)
print("The distance between Reference_Image_2 and Test Image is : {}".format(dist_test_ref_2))
>>> The distance between Reference_Image_2 and Test Image is : 137929.0223122023
Conclution
Based on previous results, we can see that the distance between our test image and our first reference image is much smaller than the distance between our test and our second reference image, which makes sense because both the test image and our first reference image are Piegon images while our second reference image is of a peacock.
In the next tutorial, we learned how to use basic math and little programming to build our own image similarity predictor with pretty decent results.
The complete code can be found together with the images. here.
About the Author
My name is Prateek Agrawal and I am a third year student at Indian Institute of Design and Manufacturing of Information Technology Kancheepuram, pursuing my B.Tech and M.Tech Dual Degree in Computer Science. I have always had a knack for machine learning and data science and have been practicing it for the last year or so and have some victories under my belt..
I personally believe that Passion is all you need. I remember getting scared hearing people talk about CNNS, RNN and Deep Learning because I couldn't understand a single part, but i didn't give up. I had the passion and I started taking small steps towards learning and here I am posting my first blog. I hope you enjoyed reading this and feel a bit self-confident. Trust me on this, yes I can, you can.
Please, write me in case of any questions or just to say hello.
LinkedIn: https://www.linkedin.com/in/prateekagrawal1405/
Github: https://github.com/prateekagrawaliiit
Credits
- Wikipedia
- AnalyticsAnalytics refers to the process of collecting, Measure and analyze data to gain valuable insights that facilitate decision-making. In various fields, like business, Health and sport, Analytics Can Identify Patterns and Trends, Optimize processes and improve results. The use of advanced tools and statistical techniques is essential to transform data into applicable and strategic knowledge.... Vidhya
- Half
- Google images
The media shown in this post is not the property of DataPeaker and is used at the author's discretion.





