
This article was published as part of the Data Science Blogathon.
Introduction
In this article, I will show how we can run a regression analysis and optimize the rental price in R, then paste the value in excel, which will later connect to Tableau again to perform further calculations with other fields in the original dataset.
This kind of seamless integration between 3 Different analysis tools can help data analysts run statistical investigations in R, then migrate the results into Tableau and view them in a digestible way for business readers.
Introduction to the dataset used and business requirements
The dataset for this example is drawn from the Capstone project within “Excel a MySQL: Analytical techniques for companies”. This is a table that contains information about the rental properties of a company, with information on the short-term rental occupancy rate and the average rental price per night. We also have data on the price in the percentile 10 and percentile 90 of similar properties in the same region.
Our business requirement is to find an optimized price for each property, so that revenue can be maximized. Since income is a function of the occupancy rate * rental price per night * 365 (assuming the property can be rented all year round), we need to express the occupancy rate as a function of the rental price per night, which can be done by simple linear regression
The next task is to run the R optim function, just like we use Solver in Excel, for each property or each row in the dataset.
With the optimized price and the expected occupancy rate, we can calculate the total gross profit of the company and do many other analyzes.
Connect R with Tableau
First we must connect Tableau with R.
Before connecting R with Tableau, make sure your R console has already installed Rserve.
library("Rserve")
Rserve()
Now, R should print ‘Starting Rserve …’. If you see this result, then R is communicating with Tableau to establish a connection.
2) Open Tableau and click Help> Configuration and performance> Manage external service connections.
3) In the dialog that opens, elija ‘localhost’ for Server and type '6311’ for Puerto.
4) Later, click Test connection
Now, a dialog box should appear saying: ‘Successfully connected to the R serve service’. It means you are ready to use R with Tableau
Create a calculated field that runs R code in Tableau
Create a calculated field and paste the following code:
SCRIPT_REAL(
"df <- data.frame(.arg1,.arg2,.arg3,.arg4,.arg5)

model <-lm(data=df,.arg1 ~ .arg2)

Create revenue function.
revenue <- function(data,through) {
par_vs_10th <- par-data$.arg3
normalized_price <-0.1+0.8*par_vs_10th/data$.arg5
fcst_occupancy <-coef(model)['(Intercept)']+coef(model)['.arg2']*normalized_price
fcst_st_revenue <-fcst_occupancy*365*par
fcst_st_revenue
}

Run optim for each row in df. Find the value of "through"-rent price-that can optimize revenue function
for (i in 1:nrow(df))
{df[i,'optimized_price'] <-optimum(122,revenue,data=df[i,],method='L-BFGS-B', control=list(fnscale = -1),lower=df[i,'.arg3']) }

#return optimized price as output for calculated field
df$optimized_price",

sum([OccupancyRate]),
avg([sample_price_percentile]),
avg([Percentile10Th Price]),
avg([Percentile 90Th Price]),
avg([percentile_90th_vs_10th]),
attr([Ws Property Id]))
The R code must be written in a function like SCRIPT_REAL, which returns numeric values. There are other similar R functions in Tableau, como SCRIPT_BOOL y SCRIPT_INT, based on the values you want to retrieve.
Before running, we must create a table: df <-data.frame (.arg1, .arg2,…)
.arg1, .arg2… are the data source fields in Tableau. It's the bold words of the code. .arg1 is the occupancy rate, .arg2 es el sample_price_percentile.
The R_code will be enclosed in brackets (”“). The last line of code: df $ optim_price will determine the return value for this calculation.
For a detailed explanation on running the linear and optimal regression in R, see link below:
This calculation is a table calculation. Make sure it is calculated together with the Property ID.
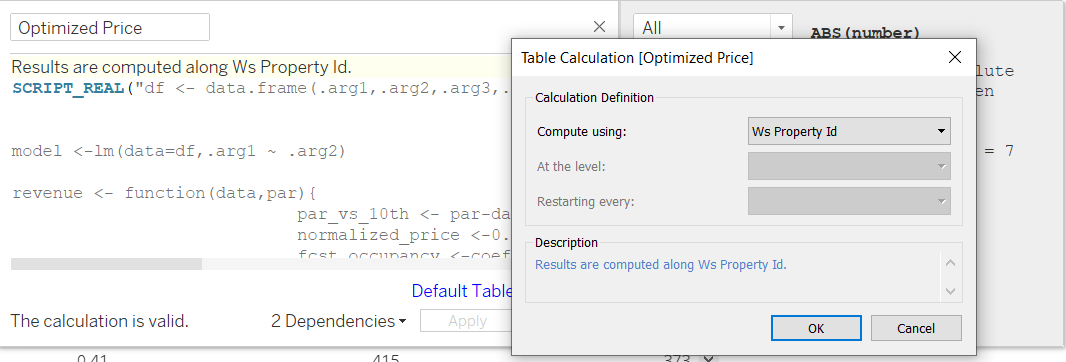
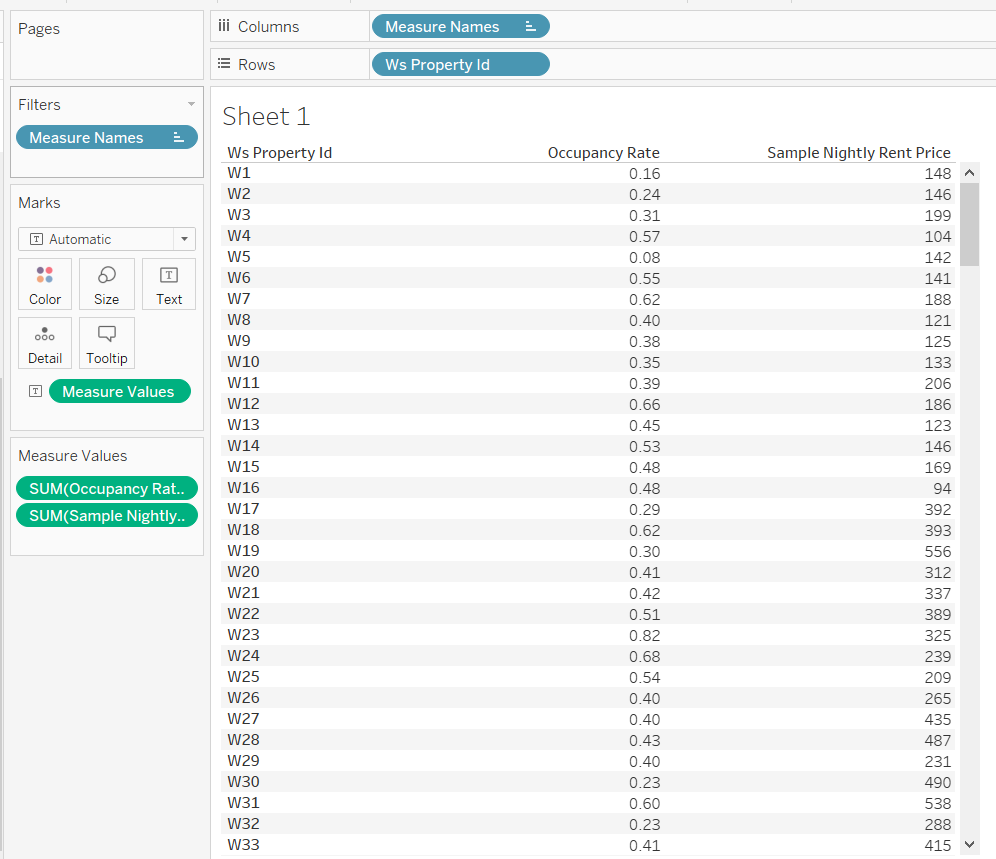
Let's create a view to see this measurement.
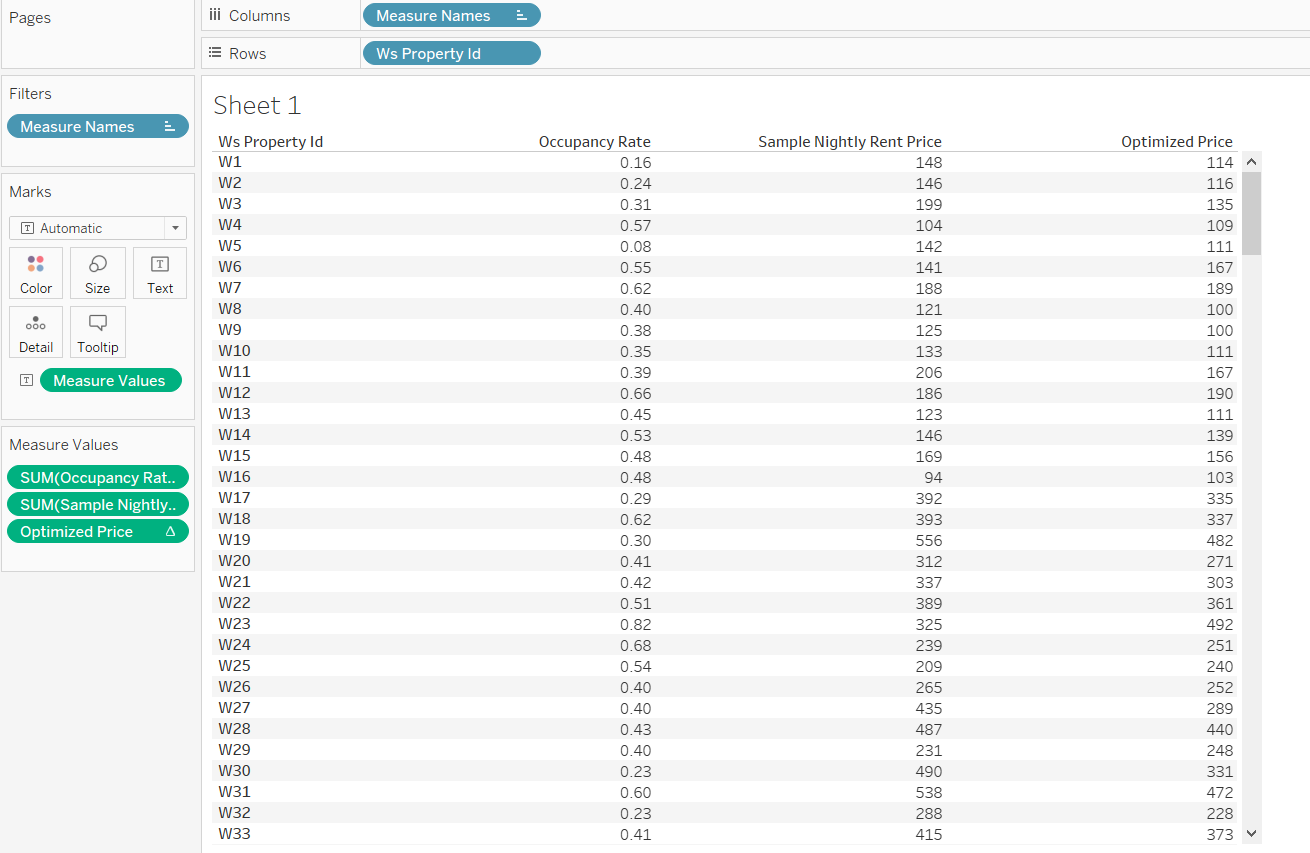
Now we have optimized the price of each property.
But nevertheless, now a problem occurs. This measure is a table calculation and we can only have a single value per property when looking at it in a table. We cannot embed it within another calculation.
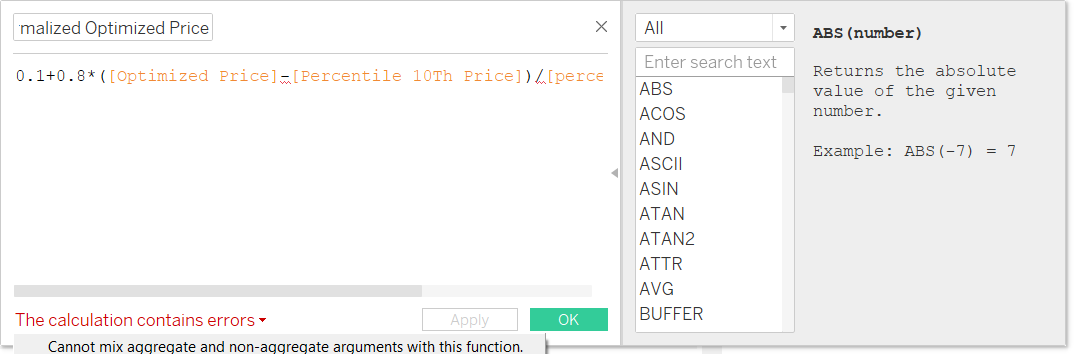
For instance, I want to normalize the optimized price to a percentile value using the following formula:
0,1 + 0,8 * (optimized price-10th percentile price) / (90th percentile vs. 10th)
Tableau will generate an error, saying we can't mix an aggregate measure with a non-aggregate value. This is really inconvenient and inflexible, as we may want to take advantage of an R-coded calculation for many more measurements.
To mitigate this problem, I came up with a workaround: write R optimized values to csv or excel file, luego una este nuevo conjunto de datos con la Data SourceA "Data Source" refers to any place or medium where information can be obtained. These sources can be both primary and, such as surveys and experiments, as secondary, as databases, academic articles or statistical reports. The right choice of a data source is crucial to ensure the validity and reliability of information in research and analysis.... original en Tableau para la creación de otras visualizaciones o medidas.
Final integration
Let's create another calculation field in Tableau, called Script. This time we will not return a numeric value, but we will write the outputs in an external CSV file. In my example, I write in CSV for simplicity, but you can also write to xlsx file if you prefer.
SCRIPT_REAL(
"df <- data.frame(.arg1,.arg2,.arg3,.arg4,.arg5)
 model <-lm(data=df,.arg1 ~ .arg2)

revenue <- function(data,through){
 par_vs_10th <- par-data$.arg3
 normalized_price <-0.1+0.8*par_vs_10th/data$.arg5
 fcst_occupancy <-coef(model)['(Intercept)']+coef(model)['.arg2']*normalized_price
 fcst_st_revenue <-fcst_occupancy*365*par
 fcst_st_revenue
 }

 for (i in 1:nrow(df)) {df[i,'optimized_price'] <-optimum(122,revenue,data=df[i,],method='L-BFGS-B', control=list(fnscale = -1),lower=df[i,'.arg3']) }
df$normalized_optimized_price<-0.1+0.8*(df$optimized_price-df$.arg3)/(df$.arg5)

#Create a new dataframe, replacing .arg2(sample_percentile_price) with the normalized optimized price
new <-data.frame(.arg2=df$normalized_optimized_price)

#Predict the occupancy rate based on optimized price and add as a new column to df
df['Forecast Occupancy']=predict.lm(model, newdata=new)

#Add Property ID to df
df['Ws Property Id']= .arg6

#Write df to a csv file
 write.table(df,'D:/Documents/Business Analytics/4. Visualization/Business Capstone/Blogathon/new.csv',sep=',',row.names=FALSE,quote=FALSE,col.names = TRUE)
 ",
sum([Occupancy Rate]),
avg([sample_price_percentile]),
avg([Percentile 10Th Price]),
avg([Percentile 90Th Price]),
avg([percentile_90th_vs_10th]),
attr([Ws Property Id]))
The next step is to create a new Sheet, called Sheet 2, for instance. Then, drag property ID and script measure to Detail on the branding card.
You should see a message like the following:
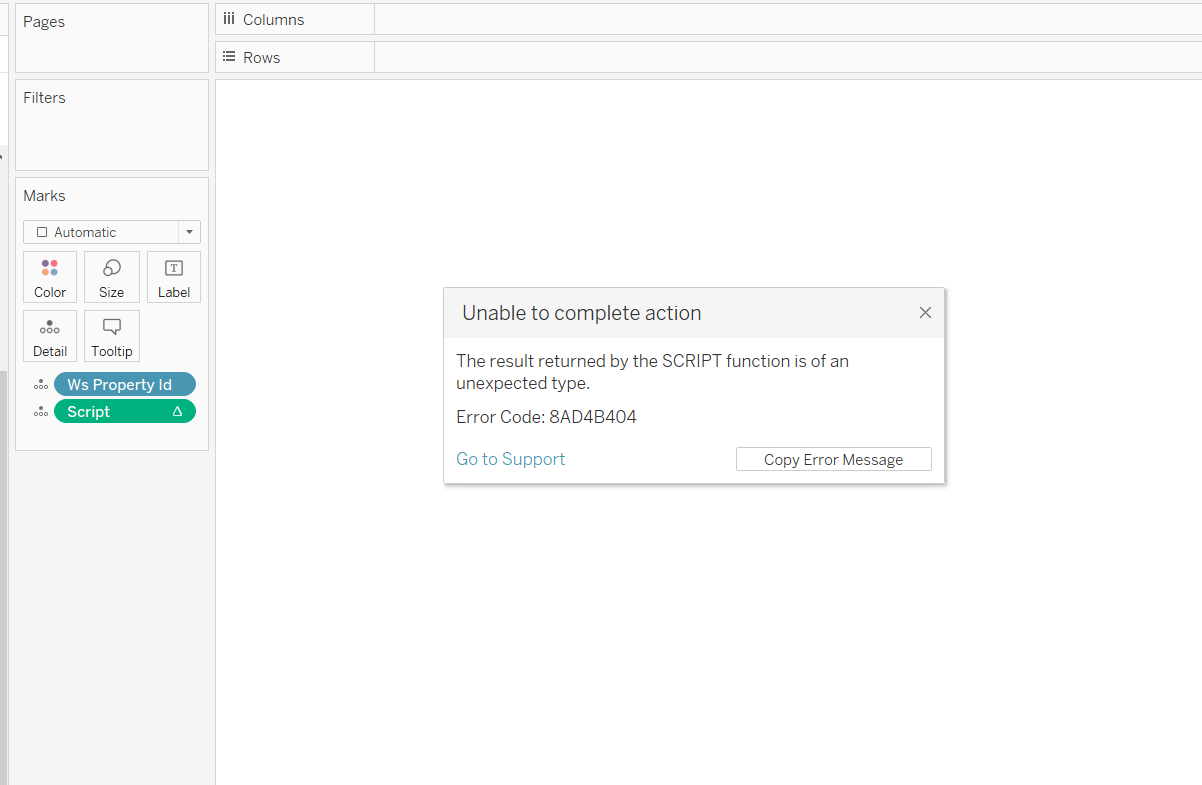
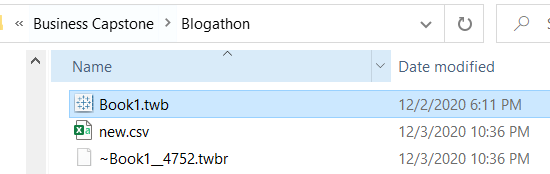
Just ignore that error message. Open the folder you specified in the script calculation and you will see that a new CSV file has just been created.
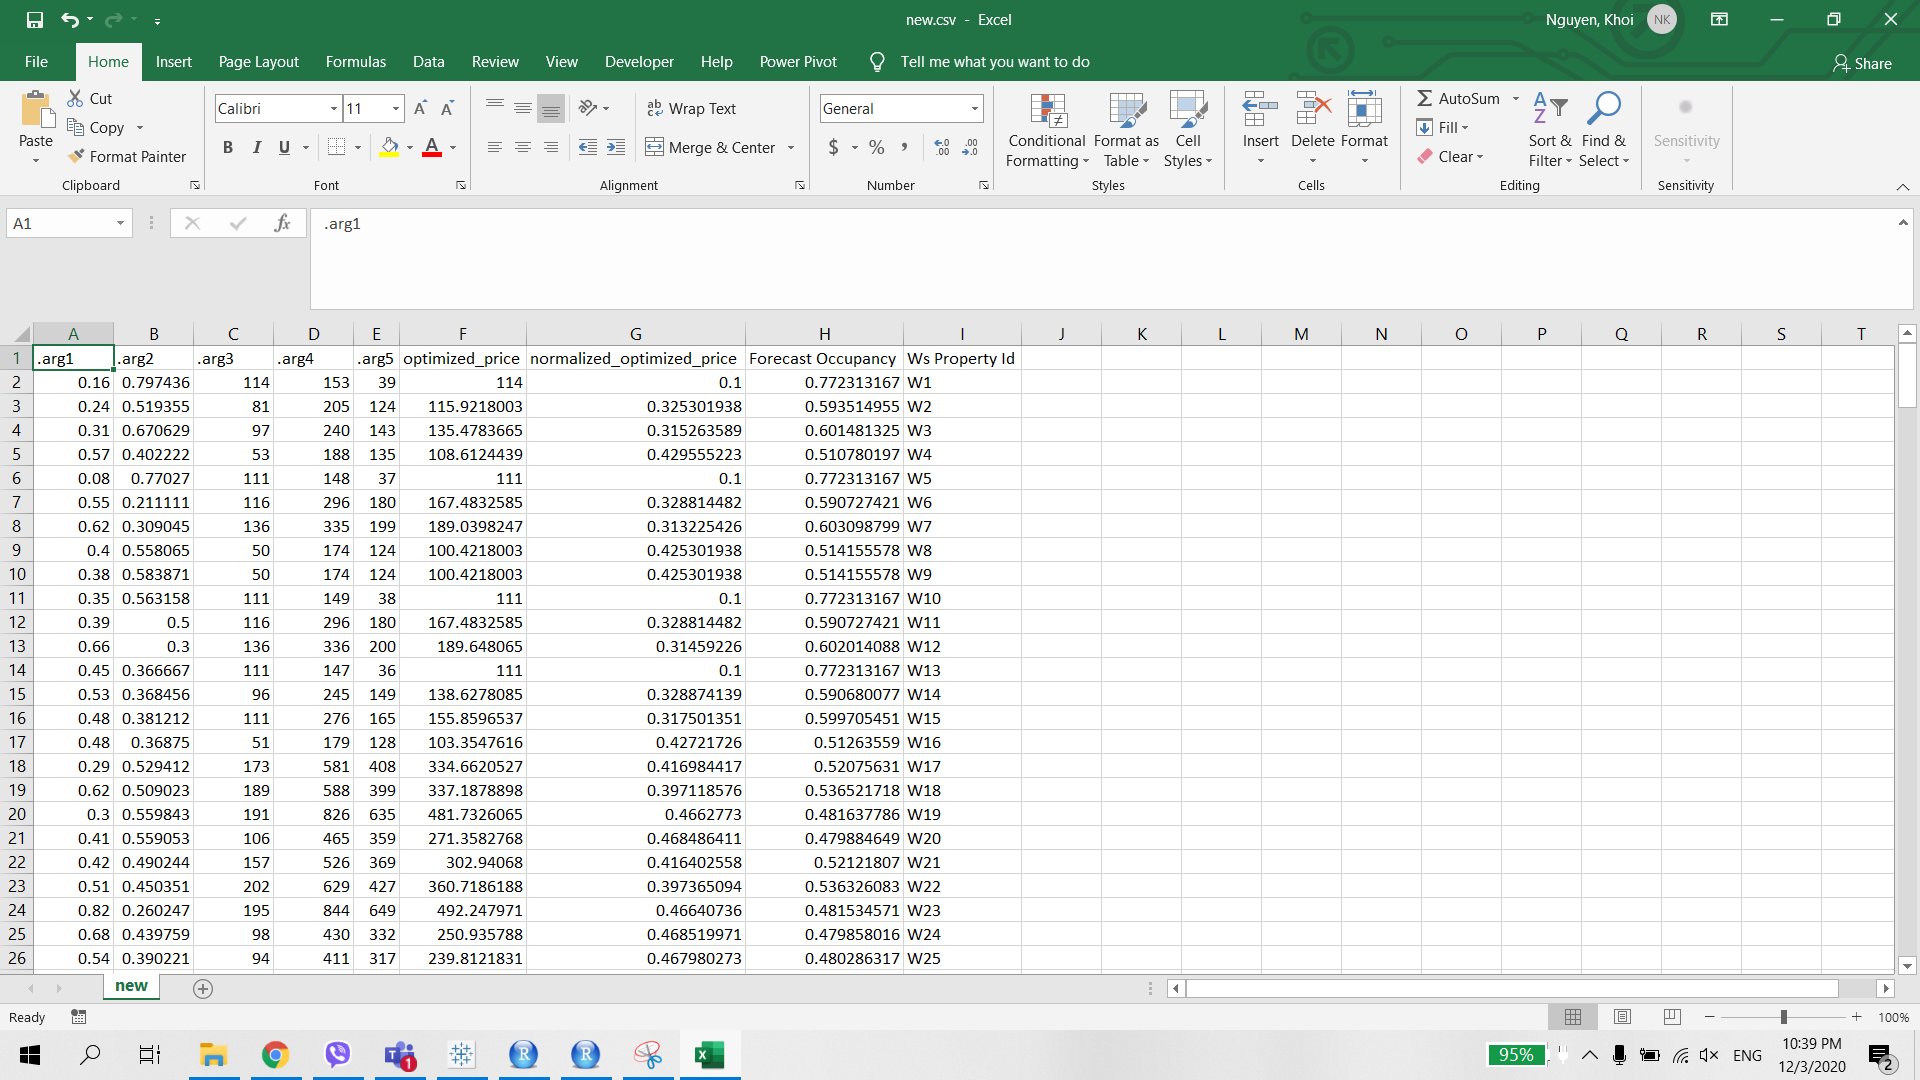
Our next task is simpler, just connect the Tableau workbook with this csv file and merge it with the original data source, according to foreign key: WS property ID.
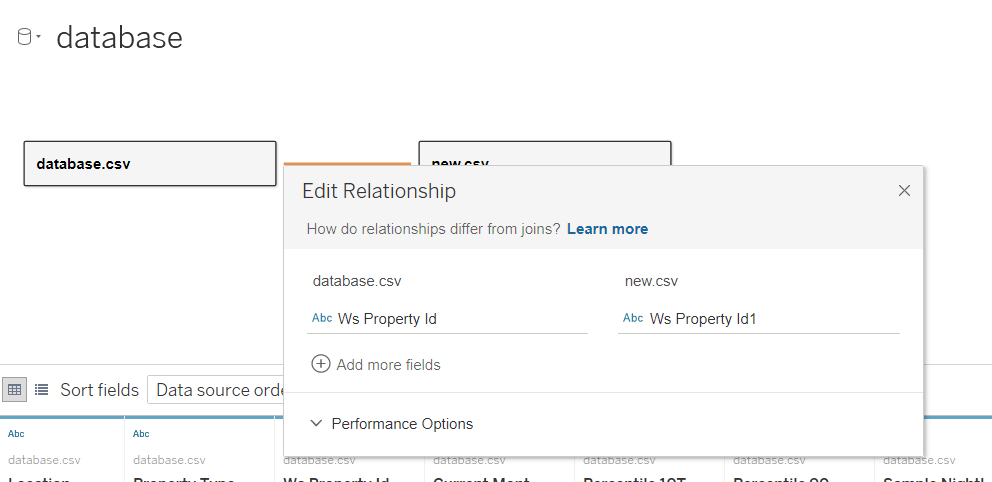
Now, in the PanelA panel is a group of experts that meets to discuss and analyze a specific topic. These forums are common at conferences, seminars and public debates, where participants share their knowledge and perspectives. Panels can address a variety of areas, from science to politics, and its objective is to encourage the exchange of ideas and critical reflection among the attendees.... of data, a new dataset is available for use.
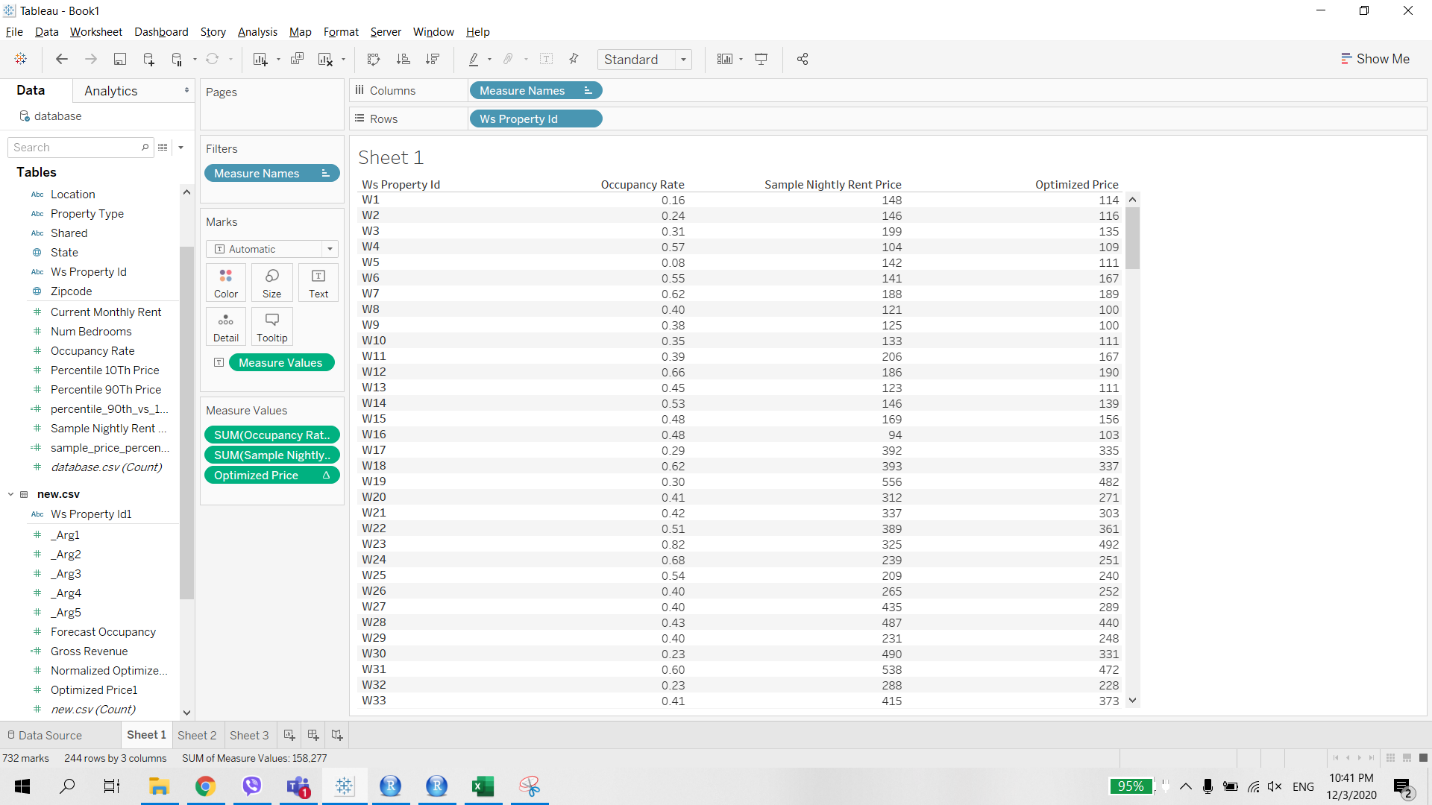
Since we have the optimized price and the expected occupancy rate as normal fields, we can use them for additional calculations without added level related problems as above.
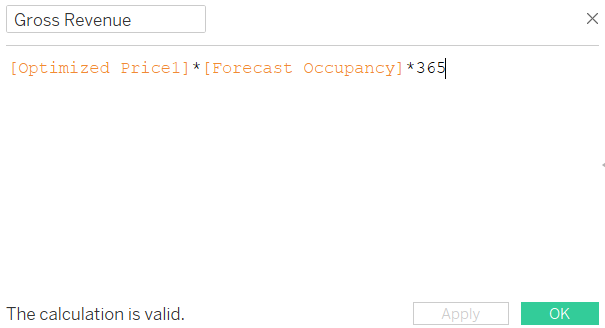
Suppose I want to create a measure called Gross Revenue = Optimized Price * Occupancy rate * 365. The calculation is now valid.
In the future, en caso de que haya cambios en los datos de trainingTraining is a systematic process designed to improve skills, physical knowledge or abilities. It is applied in various areas, like sport, Education and professional development. An effective training program includes goal planning, regular practice and evaluation of progress. Adaptation to individual needs and motivation are key factors in achieving successful and sustainable results in any discipline.... (price sign per night), or if you add more functions to the linear model. Just open the Sheet 2 again to reactivate the process and retrieve new results.
Final notes
The ability to write R code in a calculation makes Tableau more flexible than its rival, Power BI, in terms of connection with external data analysis platforms. When combining Tableau, Excel and R, we can use the power of many tools simultaneously for our analytical practices.
Have other ideas and use cases related to using Python and R in Tableau? Do not hesitate to comment on this article..





