
Introduction
R is one of the most famous programming languages for statistical analysis and computation. Because it provides a large number of functions, researchers and data scientists use it for data science and machine learning. Some of these features include interactive display libraries, fast and open source, code execution without compiler, good community and many more.
One of the main reasons it is becoming very famous is the large number of R packages for data science projects., machine learning and artificial intelligence. By using these packages, predictive models can be developed easily and efficiently. This blog lists the 10 Top R Packages You Should Know About In 2021 for data science and machine learning.
Table of Contents
- Dplyr
- ggplot2
- KernLab
- Data explorer
- Caret
- randomForest
- Shiny
- mboost
- Plotly
- SuperML
Dplyr
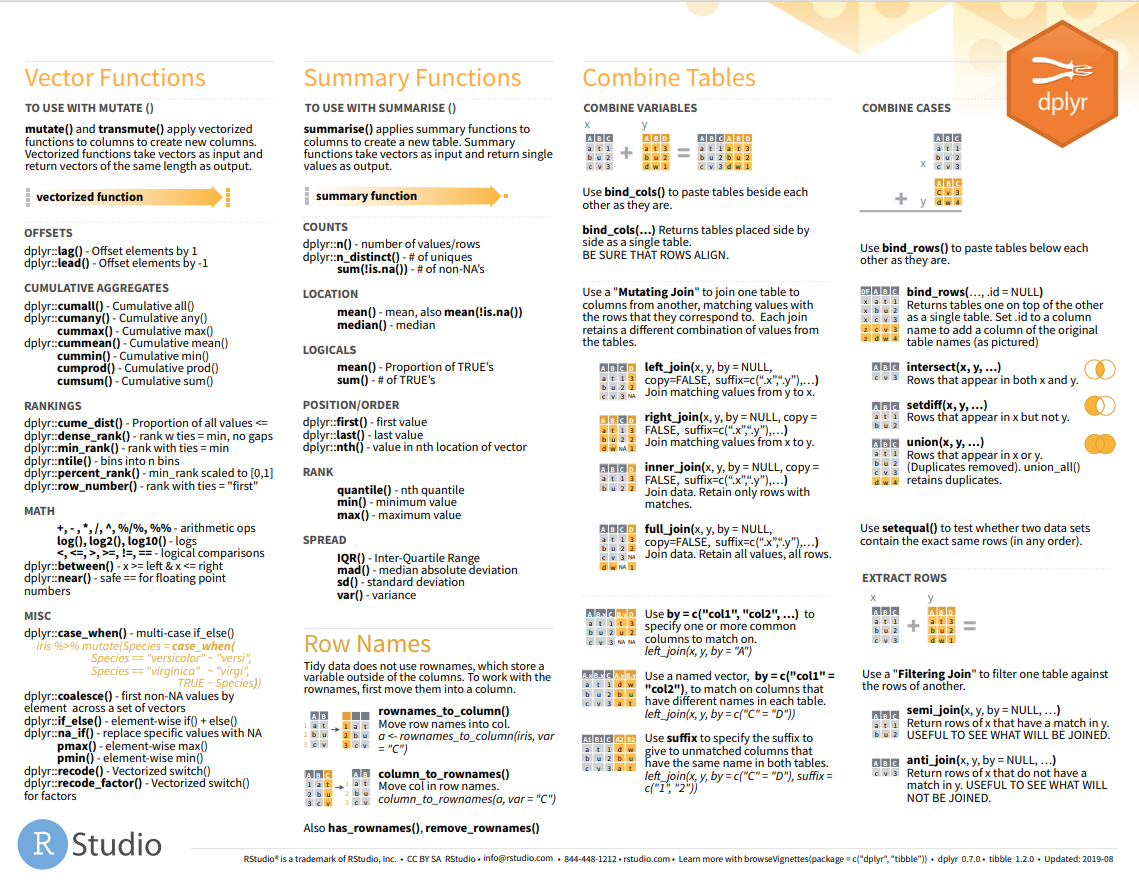
It is one of the most used R packages for data science and machine learning tasks. This pack is written by Hadley Wickham. Used to solve data manipulation tasks. Has a set of functions for data manipulation. Also called data manipulation grammar. It has a set of verbs that help us solve the most challenging data manipulation tasks like mutate (), to select (), filter (), summarize (), organize ().
To install this package, use the following code:
install.packages('dplyr')

For more information, check the link below: Introduction to dplyr
ggplot2
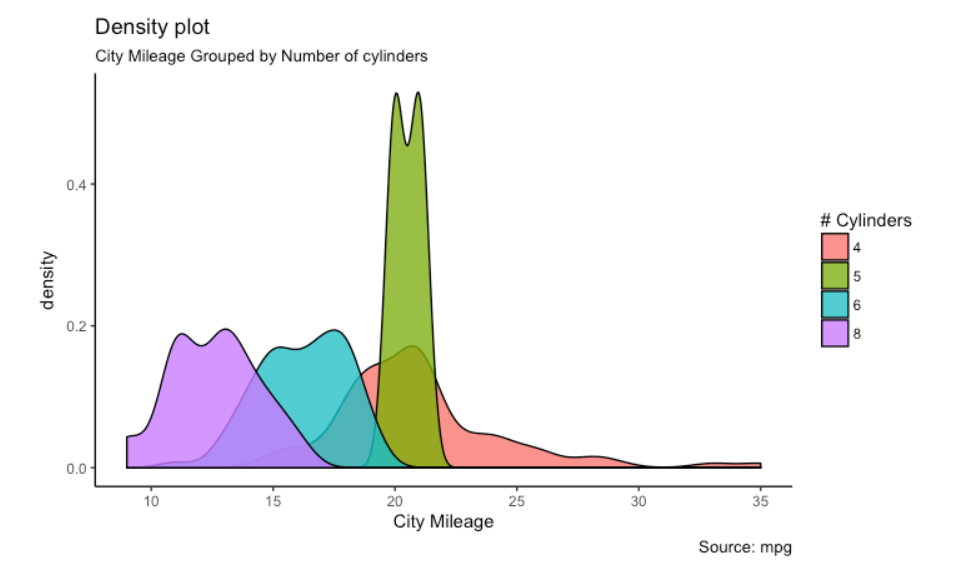
One of the most popular and widely used R packages for data visualization and exploratory data analysis. You can create interactive data visualizations with this package. Provides a wide range of beautiful patterns that take care of fine details and draw captions. This package works under a deep grammar called “Graphics grammar”. Provides a wide range of charts such as scatter charts and bubble charts. Fluctuation diagrams are graphical, histogramasHistograms are graphical representations that show the distribution of a dataset. They are constructed by dividing the range of values into intervals, O "Bins", and counting how much data falls in each interval. This visualization allows you to identify patterns, trends and variability of data effectively, facilitating statistical analysis and informed decision-making in various disciplines...., density diagrams, box plotsBox Diagrams, Also known as box and whisker diagrams, are statistical tools that represent the distribution of a dataset. These diagrams show the median, quartiles and outliers, allowing data variability and symmetry to be visualized. They are useful in comparison between different groups and in exploratory analysis, making it easier to identify trends and patterns in the data...., violin diagrams, dendrograms and many more.
To install this package, use the following code:
install.packages('gglpot2')
Below are some examples of parcels that use this package:

For more information, check the link below: ggplot2
KernLab
This package is also called kernel-based machine learning lab. This package is used for regression, classification, dimensionality reduction, anomaly detection, groupingThe "grouping" It is a concept that refers to the organization of elements or individuals into groups with common characteristics or objectives. This process is used in various disciplines, including psychology, Education and biology, to facilitate the analysis and understanding of behaviors or phenomena. In the educational field, for instance, Grouping can improve interaction and learning among students by encouraging work... If you want to use algorithms that involve a kernel-based approach, you can use it as SVM, classification algorithm, kernel characteristics analysis and many more. It is widely used for SVM implementations. Has a wide range of kernel functions, as for the polynomial kernel function, we can use polydot (), the hyperbolic tangent kernel function for tanhdot (), etc.
To install this package, use the following code:
install.packages('kernlab')
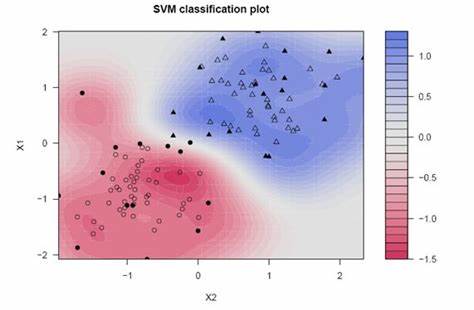
For more information, check the link below: Kernlab package
Data explorer
This R package is one of the easiest to use for data science and machine learning. This package mainly focuses on three objectives:
- Exploratory data analysis
- Function engineering
- Data report
This package automated exploratory data analysis for predictive modeling and analysis tasks by visualizing every feature present in our dataset..
To install this package, use the following code:
install.packages('DataExplorer')
To find a broad overview of our dataset, we can use the following code:
introduce(data)
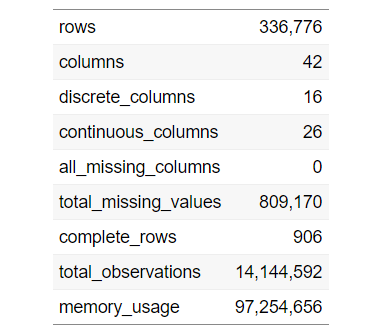
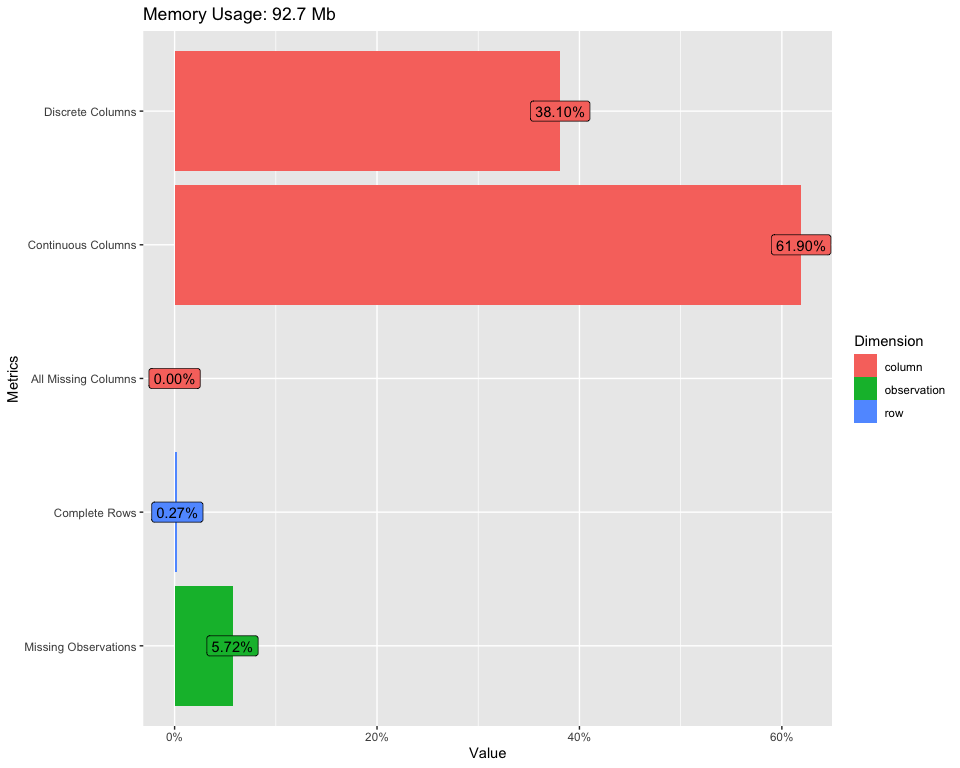
To display the table above, use the following code:
plot_intro(data)
For more information, check the link below: Introduction to DataExplorer
Caret
This is also called trainingTraining is a systematic process designed to improve skills, physical knowledge or abilities. It is applied in various areas, like sport, Education and professional development. An effective training program includes goal planning, regular practice and evaluation of progress. Adaptation to individual needs and motivation are key factors in achieving successful and sustainable results in any discipline.... classification and regression. It is one of the best packages for data science and machine learning tasks. Contains a set of functions that are used to create predictive models. Has other functionalities, as well as selection of features, data division, data preprocessing, fit models, importance of features and many more.
To install this package, use the following code:
install.packages('caret')
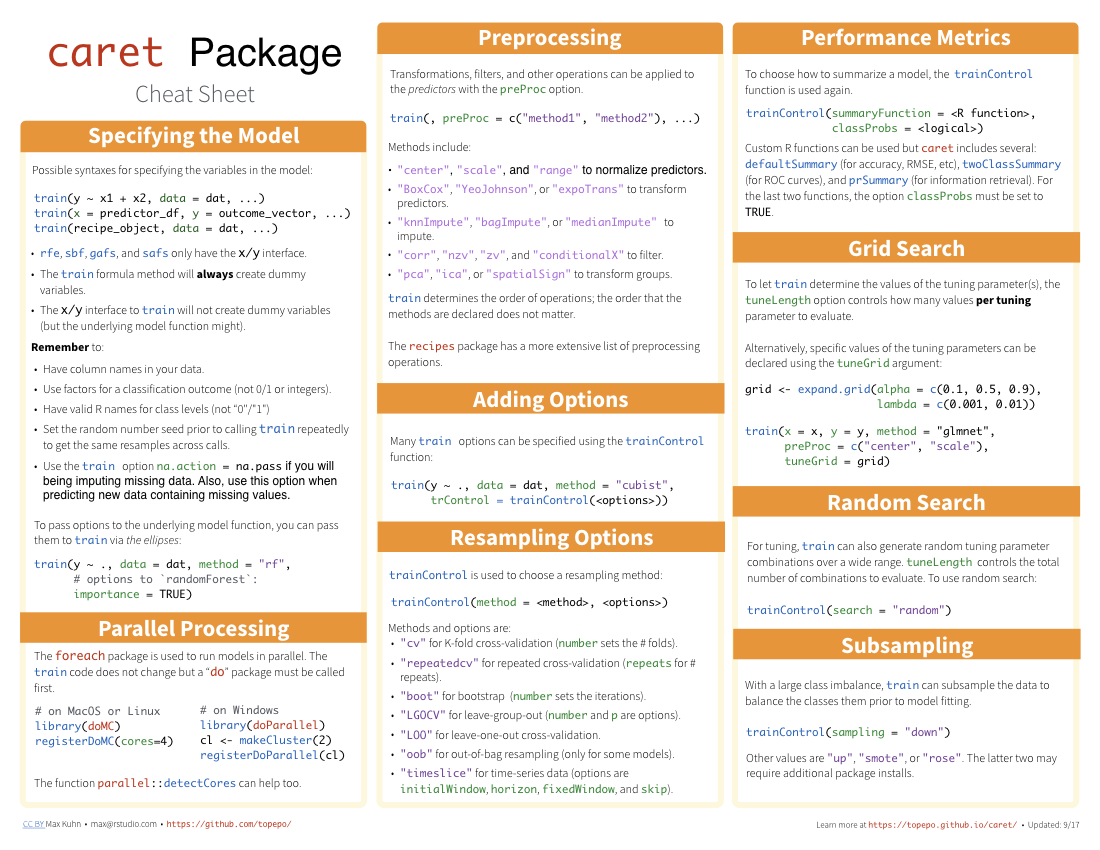
For more information, check the link below: Caret of the package
randomForest
Random Forest is one of the most popular R packages for machine learning. This package is used to create random forests in R. Can be used for both classification and regression tasks. We can also use it to train missing values and outliers. This package uses Breiman's random forest algorithm to build decision trees.
To find a broad overview of our dataset, we can use the following code:
install.packages('randomForest')
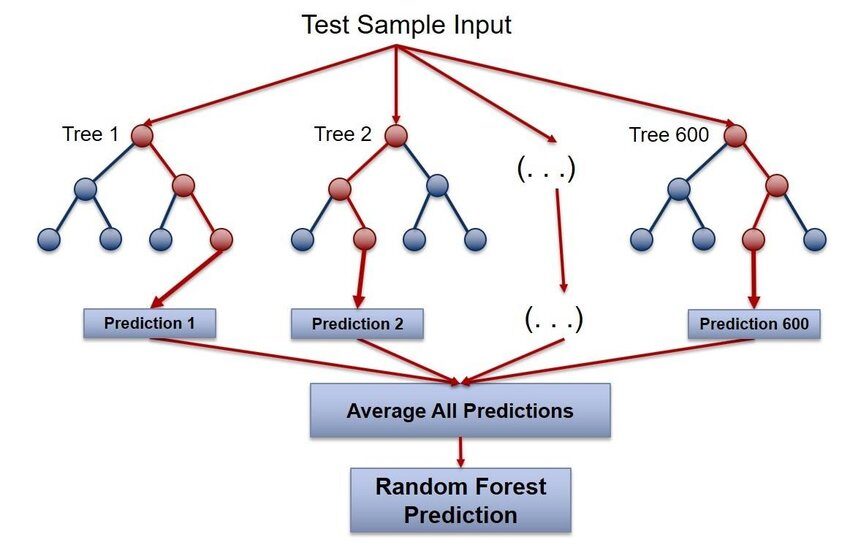
For more information, check the link below: Random forest
Shiny

It is an R package that is used to create an interactive web application for data science. It helps us create R web applications without much effort. Shiny creates web applications that are deployed on the web using its server or R shiny's hosting services. R shiny features include creating an application with less knowledge of web tools, provides live views, rendering functions and many more.
Shiny web application example:
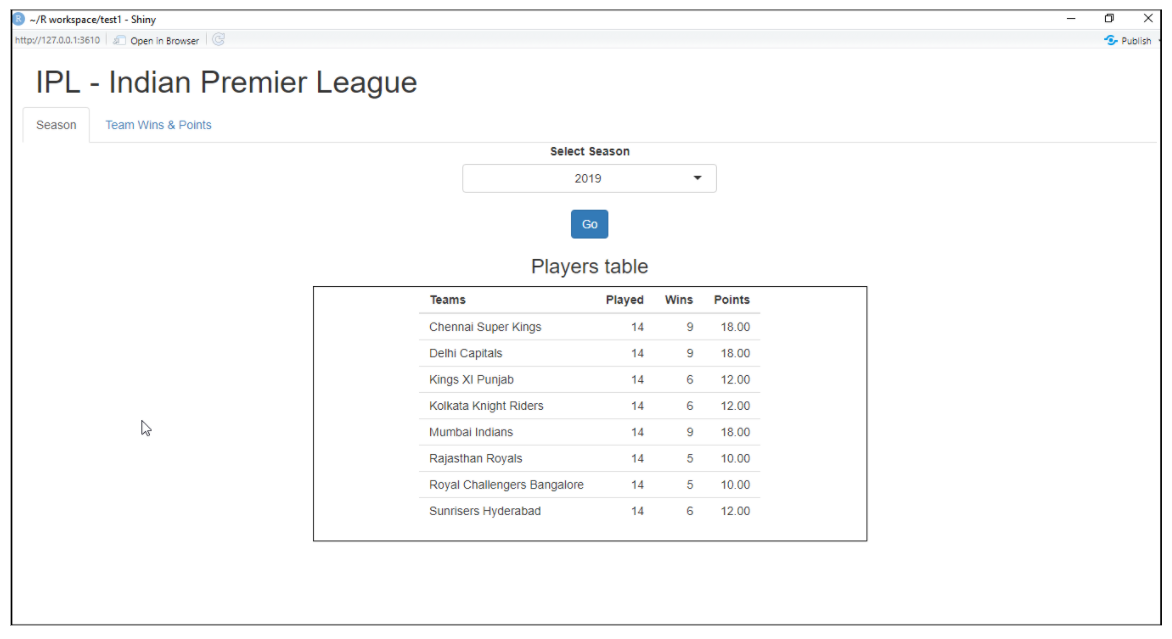
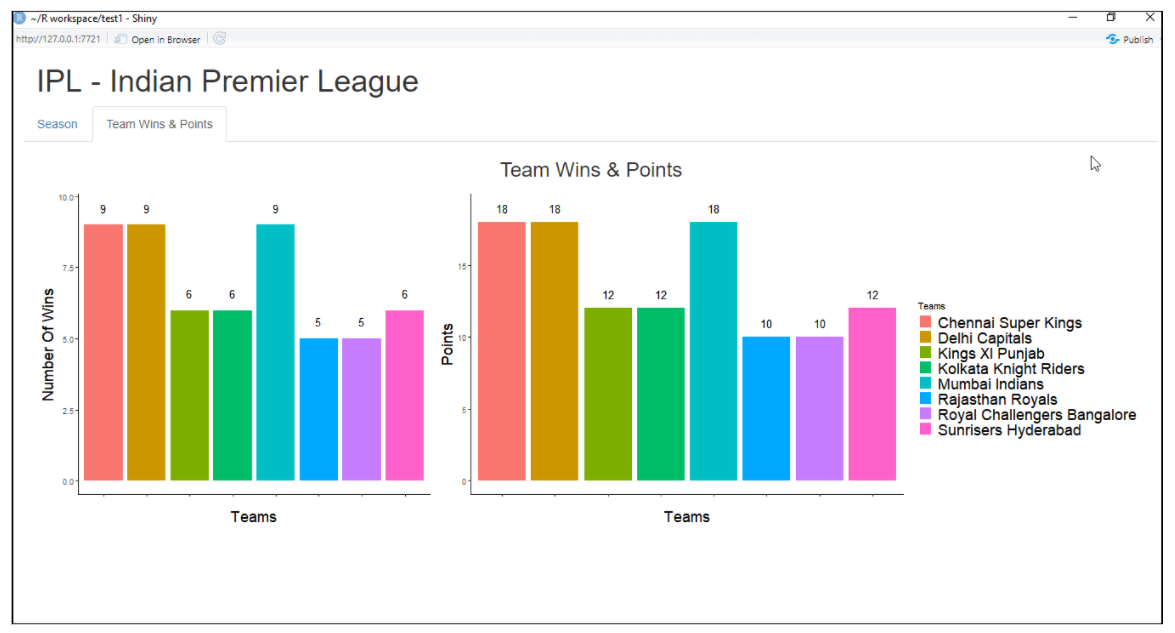
For more information, check the link below: Shiny
mboost
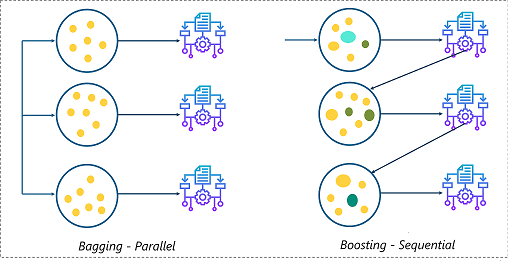
This package is used in data science for model-based impulse packets and has a functional downstream algorithm of gradientGradient is a term used in various fields, such as mathematics and computer science, to describe a continuous variation of values. In mathematics, refers to the rate of change of a function, while in graphic design, Applies to color transition. This concept is essential to understand phenomena such as optimization in algorithms and visual representation of data, allowing a better interpretation and analysis in... to optimize decision trees. It also provides an interaction model for potentially high-quality data. dimension"Dimension" It is a term that is used in various disciplines, such as physics, Mathematics and philosophy. It refers to the extent to which an object or phenomenon can be analyzed or described. In physics, for instance, there is talk of spatial and temporal dimensions, while in mathematics it can refer to the number of coordinates necessary to represent a space. Understanding it is fundamental to the study and....
To install this package, use the following code:
install.packages('mboost')
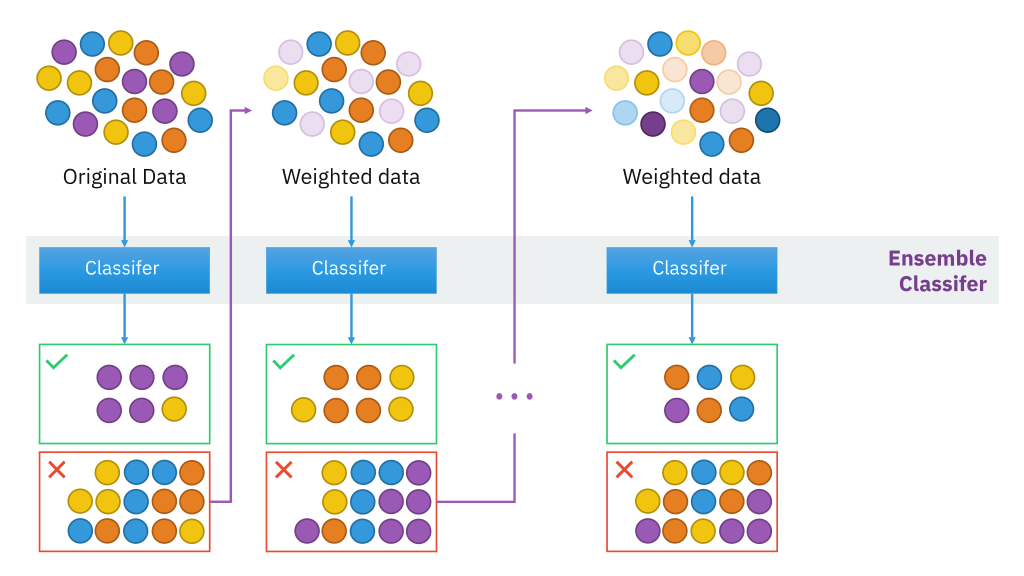
For more information, check the link below: mboost
Plotly
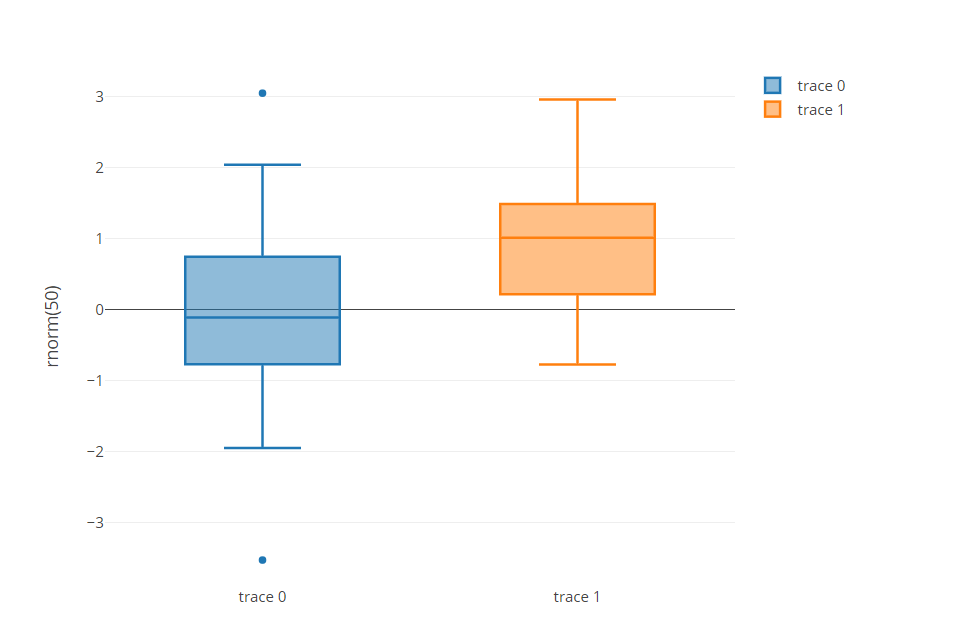
It is a graphics library that creates interactive graphics. It is a high-level interface for plotly.js, based on d3.js. Provides an easy-to-use user interface to generate elegant interactive D3 graphics. These interactive charts provide many functionalities, such as the ability to zoom in and out of graphics, hover over a point for additional information, filter data and much more.

Provide an example of graphs as scatterplots, line diagrams, bar charts, circular carts, bubble diagrams, box plots, histogramas, error bars, violin diagrams and much more.
For more information, check the link below: Plotly
SuperML
Superml is one of the famous R packages for AI that provides a standard interface to clients using Python and R programming dialects to build AI models. This package essentially provides the highlights of Scikit Learn and predicts the interface for preparing AI models in R. In addition to building AI models, there are convenient functionalities for performing function engineering.
To install this package, use the following code:
install.packages('superml')
For more information, check the link below: SuperML
Thank you for reading this article and for your patience.. Leave me in the comment section about comments. Share this article, it will give me the motivation to write more blogs for the data science community.
Thanks for reading this. If you like this article, Share it with your friends. In case of any suggestion / doubt, comment below.
Email identification: [email protected]
Follow me on LinkedIn: LinkedIn
The media shown in this article is not the property of DataPeaker and is used at the author's discretion.





