The Markov chain is a simple concept that can explain the most complicated real-time processes. Voice recognition, text identifiers, path recognition and many other artificial intelligence tools use this simple principle called the Markov chain in some way. In this article we will illustrate how easy this concept is to understand and implement it in R.
The Markov chain is based on a principle of “memory loss”. In other words, the next state of the process only depends on the previous state and not on the sequence of states. This simple assumption makes it easy to calculate the conditional probability and allows this algorithm to be applied in various scenarios.. In this article we will limit ourselves to a simple Markov chain. In real life trouble, we generally use the latent Markov model, which is a highly evolved version of the Markov chain. We will also talk about a simple application of the Markov chain in the next article..
A simple business case
Coca-Cola and Pepsi are the only companies in country X. A soft drink company wants to link up with one of these competitors. They hire a market research company to find out which of the brands will have a higher market share after 1 my. Nowadays, Pepsi owns the 55% and Coke owns the 45% of market share. Below are the conclusions drawn by the market research company:
P (P-> P): Probability that a customer will stick with the Pepsi brand for a month = 0,7
P (P-> C): probability that a customer will switch from Pepsi to Coca-Cola during a month = 0,3
P (C-> C): Probability that a customer will stay with the Coke brand for a month = 0.9
P (C-> P): Probability that a customer will switch from Coca-Cola to Pepsi in a month = 0,1
We can clearly see that customers tend to stick with Coca-Cola, but Coca-Cola currently has a lower wallet share. Therefore, we can't be sure of the recommendation without doing some transition calculations.
Transition diagram
The four statements made by the research company can be structured into a simple transition diagram.
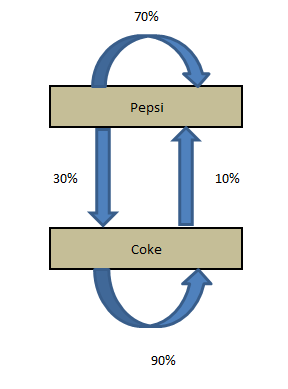
The diagram simply shows the transitions and the current market share. Now, if we want to calculate market share after one month, we must do the following calculations:
Market share (t + 1) Pepsi = Pepsi's current market share * P (P-> P) + Coca-Cola's current market share * P (C-> P)
Market share (t + 1) of Coca-Cola = Current market share of Coca-Cola * P (C-> C) + Pepsi's current market share * P (P-> C)
These calculations can be done simply by looking at the following matrix multiplication:
Transition matrix of the current state X = final state
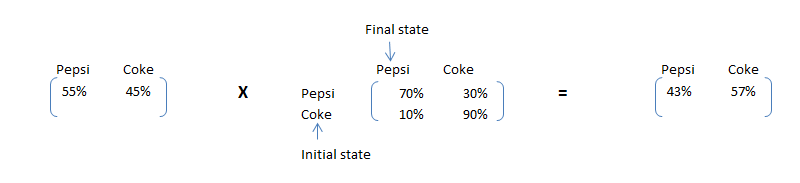
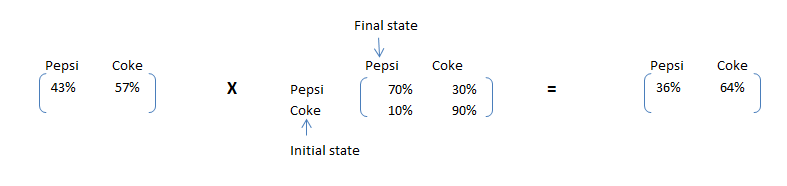
As we can see, we clearly see that Pepsi, although it has a higher market share now, will have a lower market share after one month. This simple calculation is called a Markov chain.. If the transition matrix does not change over time, we can predict market share at any future time. Let's do the same calculation for 2 months later.
Steady state calculations
In addition to the business case that concerns us, the soft drink company wants to reduce the gap in the market share of the company Coke and Pepsi in the long term. This will help them frame the right cost strategy as they dive into Coca-Cola.. Pepsi's share will continue to decline to a point where the number of customers leaving Pepsi and the number of customers adapting to Pepsi is the same. Therefore, we need to satisfy the following conditions to find the steady state proportions:
Pepsi MS * 30% = Coca-Cola MS * 10% …………………………………………… ..1
Pepsi MS + Coca-Cola MS = 100% …………………………………………………… 2
4 * Pepsi MS = 100% => Pepsi MS = 25% and Coca-Cola MS = 75%
Let's formulate an algorithm to find the steady state. After steady state, multiplying the initial state with the transition matrix will give the initial state itself. Therefore, the matrix that can satisfy the following condition will be the final proportions:
Initial state X Transition matrix = Initial state
By solving the above equation, we can find the steady state matrix. The solution will be the same as [25%,75%].
Now let's solve the previous example in R.
Implementation in R
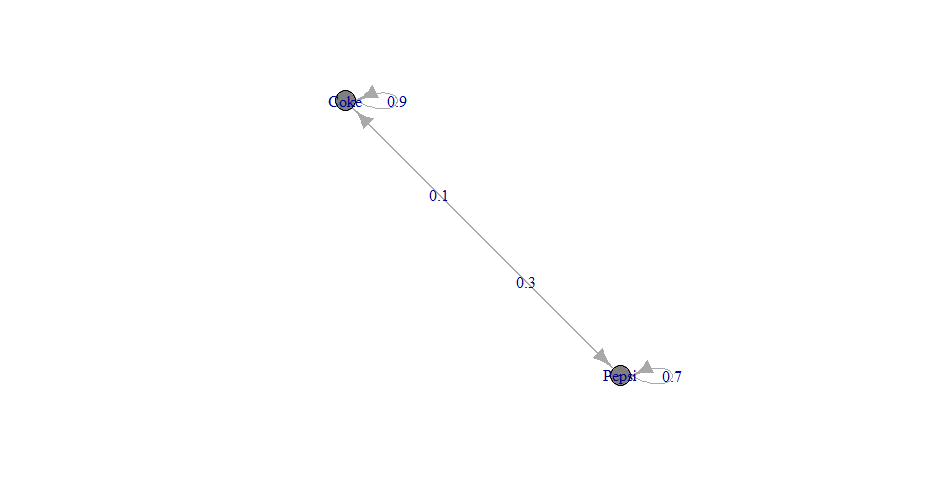
Paso 1: creating a transition matrix and a discrete-time Markov chain
Production
trans_mat
[,1] [,2]
[1,] 0.7 0.3
[2,] 0.1 0.9


#create the Discrete Time Markov Chain
MC 1
A 2 - dimensional discrete Markov Chain defined by the following states:
Pepsi, Coke
The transition matrix (by rows) is defined as follows:
Pepsi Coke
Pepsi 0.7 0.3
Coke 0.1 0.9
Plot
Paso 2: Calculate market share after 1 month and 2 months
Production
#Market Share after one month

Pepsi Coke
0.43 0.57

#Market Share after two month

Pepsi Coke
0.358 0.642
Paso 3: creating a steady state matrix
Production
Pepsi Coke
0.25 0.75
Final notes
In this article we introduce you to the Markov chain equations, terminology and its implementation in R. We also discuss how simple equations can be scaled using matrix multiplication.. We will use these terminologies and framework to solve a real life example in the next article.. También le presentaremos conceptos como nodeNodo is a digital platform that facilitates the connection between professionals and companies in search of talent. Through an intuitive system, allows users to create profiles, share experiences and access job opportunities. Its focus on collaboration and networking makes Nodo a valuable tool for those who want to expand their professional network and find projects that align with their skills and goals.... absorbente y cadena de Markov regular para resolver el ejemplo.
Was the article helpful to you? Did this article solve any of your existing problems? Have you used a simple Markov chain before? If he did, share with us your thoughts on the matter.


