
But, before analyzing Power BI, let's first understand what Business Intelligence is.
Business Intelligence: What is it about?
Data science deals with data and is very useful in analytics and machine learning these days. Data science and exploratory data analysis help find patterns and observations that are useful and productive. EDA explores data and helps us discover completely new aspects of data. In the field of business, the main equation is to maximize profits and increase business efficiency. Business intelligence is about working through data and extracting useful management insights and intelligence.
The data and conclusions, if used correctly, can increase the profitability of a company many times. Business intelligence enhances the overall business framework and optimizes it to produce intended or intended results.
BI software like Power BI and Tableau help you work with and get useful insights from it. BI software has key features like data visualization, visual analysis, control panels, etc. BI software automates many things, eliminates the need for static spreadsheets and presentation tools. With BI tools, companies can take action using data and identifying problems, trends are simplified.
The purpose of BI is to help control the vast flow of business information inside and outside the organization., first identifying and then processing the information into useful and condensed managerial intelligence and knowledge. BI helps organizations gain insight and draw conclusions from relevant data on business decision drivers, such as standards and variations in production, the demand, quality control and internal mechanisms of the organization. The ultimate goal of BI in any company is to make optimal decisions at all levels of the company in the most efficient and fast way possible..
Dealing with the problem with BI software has the following steps:
1. Data collection
2. Data storage
3. Data cleansing
4. Analysis of data
5. Display
6. Decision
Using Power BI is very easy, all these steps can be implemented without much trouble in Power BI.
Our data can be a simple Excel file or even a complex cloud data warehouse, Power Bi will allow us to easily connect to our data sources, to view, analyze and understand our data. Not only can Power BI help us generate quick insights and analytics, it can also help us in large-scale real-time analysis of large amounts of data. Therefore, Power BI can help with data analysis needs not only for a small business, but also for large-scale corporations that handle a large amount of data.
What is Microsoft Power BI?
Power BI consists of three main parts:
1. Power By Desktop: a Microsoft Windows desktop application.
2. Power BI service: a software application as a service (SaaS) online.
3. Power BI mobile app: available as an application for Android and iOS.
These services help to use them in a kind of ecosystem, to consume business information in the way that works best for them. As usual, a report is created on the Power BI desktop and then shared to the Power BI service for other team members to use or view. Users who are on the go can also see them in the Power BI mobile apps. Dashboards and reports are easily shared and, Thus, it's very easy for team people and external stakeholders (yes there are) see them.
This makes it the ideal tool for analyst firms., consulting firms or other service firms that work with multiple clients and teams.
The entire structure of Power BI is divided into the basic components of Power BI. These are the building blocks that make up the entire operation of Power BI.
Son :
1. Visualizations
2. Data sets
3. Reports
4. Board
5. Tiles
Datasets are a collection of data that Power BI uses to create your visualizations. Visualizations are a visual representation of that data, can be diagrams, graphics, maps or any other way to visually interpret the data. A report is a collection of visualizations that appear together on one or more pages.
The dashboard is a collection of reports that we create to share. A mosaic is a single display on a board.
All of these tools can be used to create visually pleasing dashboards where a great team can work together.. Power BI service and Power BI desktop work together seamlessly. In the desktop version, the user interface is simple, looks like any other Microsoft software like PowerPoint or Word. Any user who has experience working with MS Office will find the Power BI user interface very easy to use..
Data analysis can be overwhelming for many people, but the simple yet powerful features of Power BI make it a tool that can be used for a wide variety of applications.
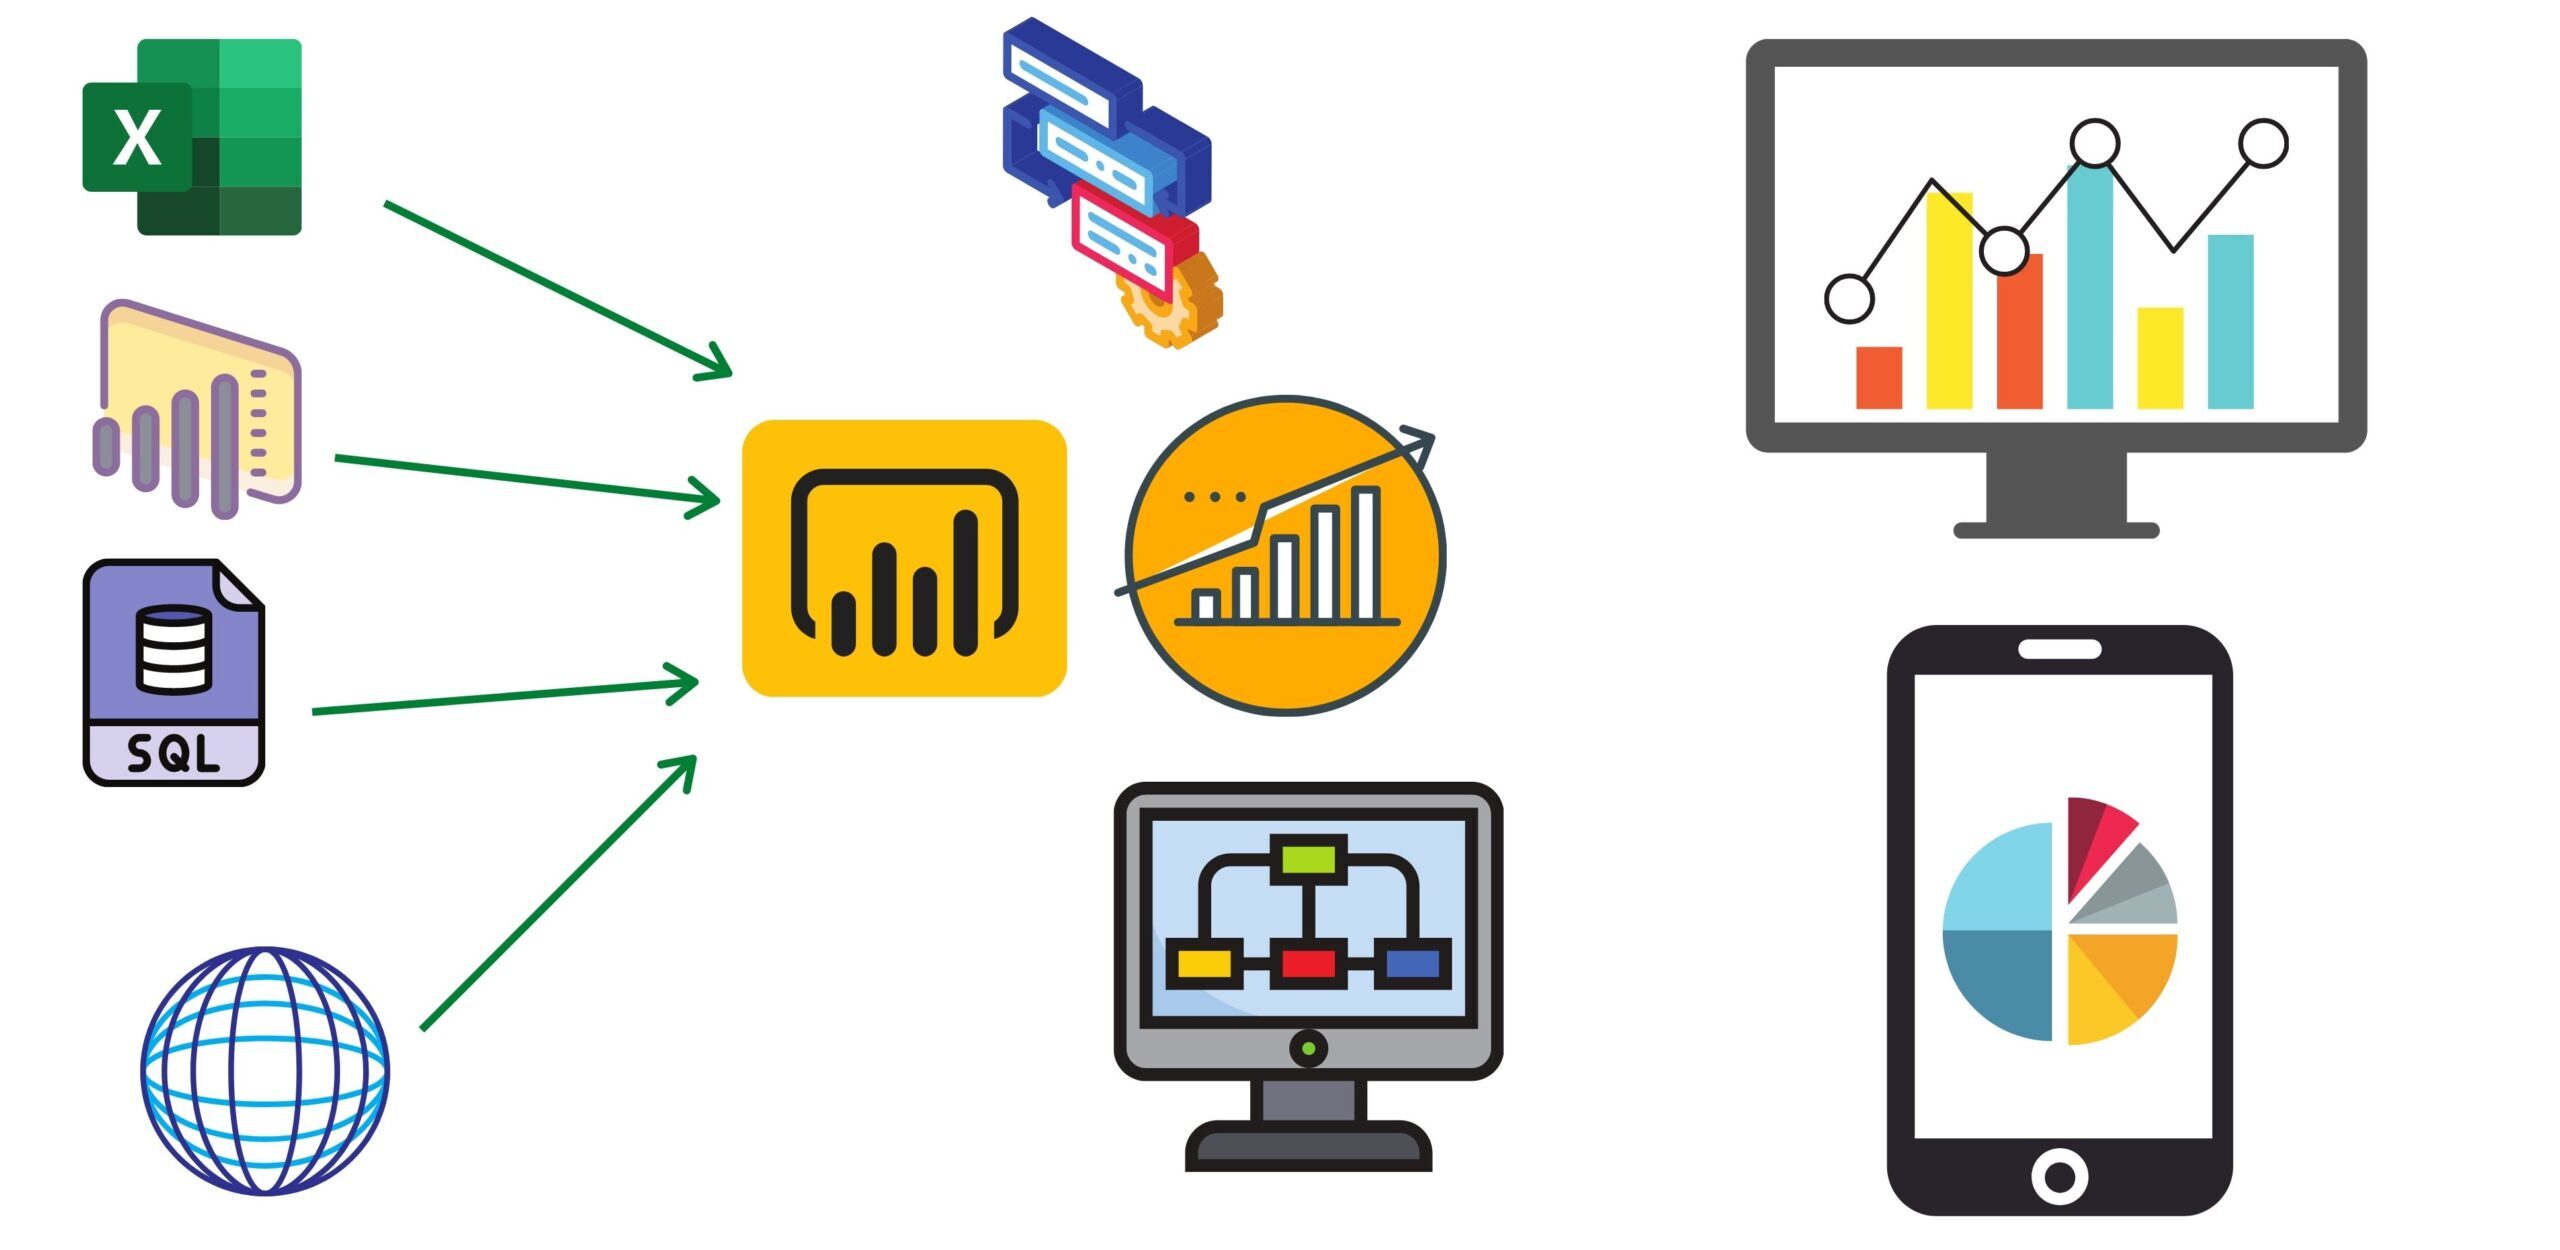
As we connect to data sources, we can choose between Excel files, Power BI data sets or data streams, servidores SQL, web data, csv files and many more. We can also use Power Query to transform data in Power BI. Data from various sources can also be combined. We can also clean and transpose data in Power BI.
Let's try some visualizations in Power BI. Images are tools that help us present data in a compelling and insightful way, and help you show your important components. Data visualization is one of the core parts and basic building blocks of Power BI. Well-designed visuals are one of the most effective ways to present and share our data.. For instance, a chart or graph can be used to present data visually.
Common visualizations in Power BI
1. Maps
2. Chart display
3. Stacked area chart
4. Pie chart
5. Bar graphic
Get data in Power BI
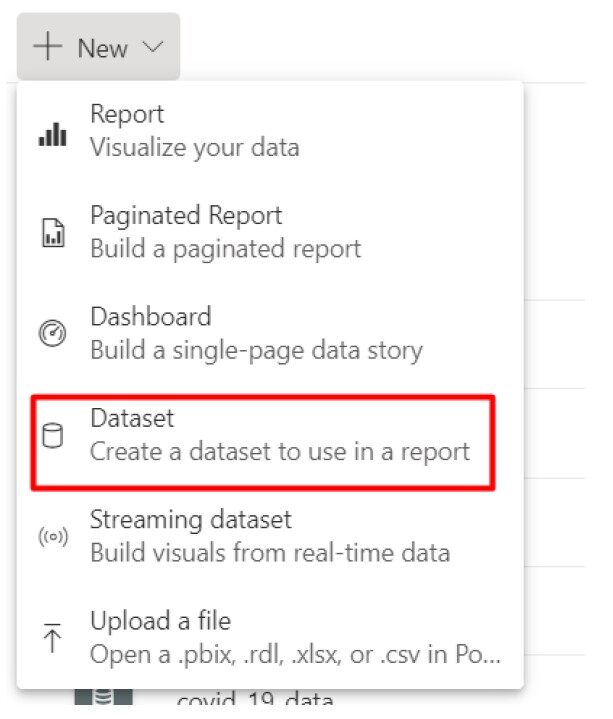
Here, let's refer to the Power BI service. In your workspace, there will be an option “New”, select dataset from there.
This will take you to a new window, where you need to select the data source.
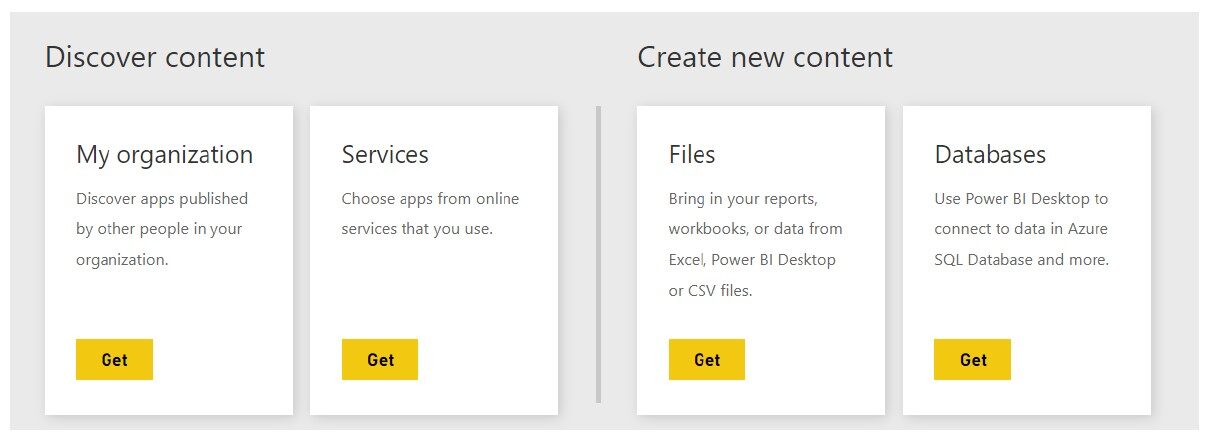
Depending on the type of work you do, can grab data from online data source or local CSV file.
Your datasets and data streams are listed under Datasets + Data streams.
These things vary from version to version, or the type of Power BI license you have (or owned by your organization). But, in a nutshell, getting data in Power BI is very simple.
Power BI has many clear benefits that led to its place as a data analytics and BI powerhouse., let's see some of them.
Data analysis expressions (DAX)
Multiple DAX expressions can also be used in Power BI. They can be used for data manipulation and work with the data. DAX makes it very easy to work with large volumes of data, which makes it a very good BI tool. This kind of flexibility in working with data makes Power BI so popular with analysts and data scientists..
Read this article to learn more about DAX:
10 useful functions of data analysis expressions (DAX) for Power BI beginners
Report publishing and streamlined pipelines
How dashboards can be published directly to Power BI, sharing is easy. Analysts no longer need to share large files via email or a cloud drive. As the pipeline is optimized, dashboards update as soon as underlying data is updated.
Microsoft Trust for Business Software
Microsoft is, undoubtedly, a name everyone in the tech world knows. Microsoft already has a large customer base, including corporations and personal users. Everyone knows how to use Word or Powerpoint, this makes the implementation of Power BI in the market very easy and finding clients is not very difficult.
Artificial intelligence
With Power BI, users can access image recognition and text analysis and also integrate with Azure Machine Learning. This support is often a game changer.
Wide variety of visuals
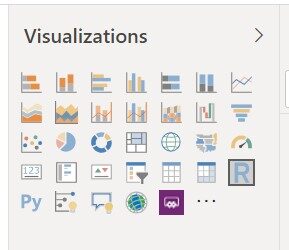
Power BI has a large number of customizable visuals and many templates that help companies better understand their data. The human brain can easily process visual information; therefore, it is easier to use images, charts or graphs to understand and visualize large amounts of complex data. There are many types of visualizations in the right pane of Power BI. One can simply use drag and drop to put the data on these images.
Suppose we work with Melbourne Housing Dataset.
Let's take the example of the stacked area chart.
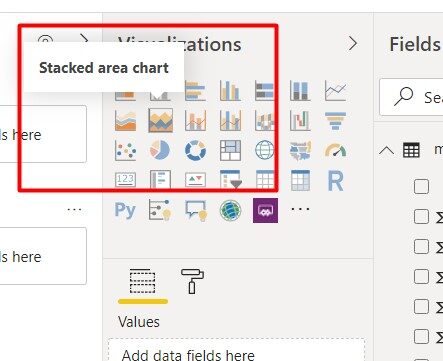
We drag and drop it into the workspace.
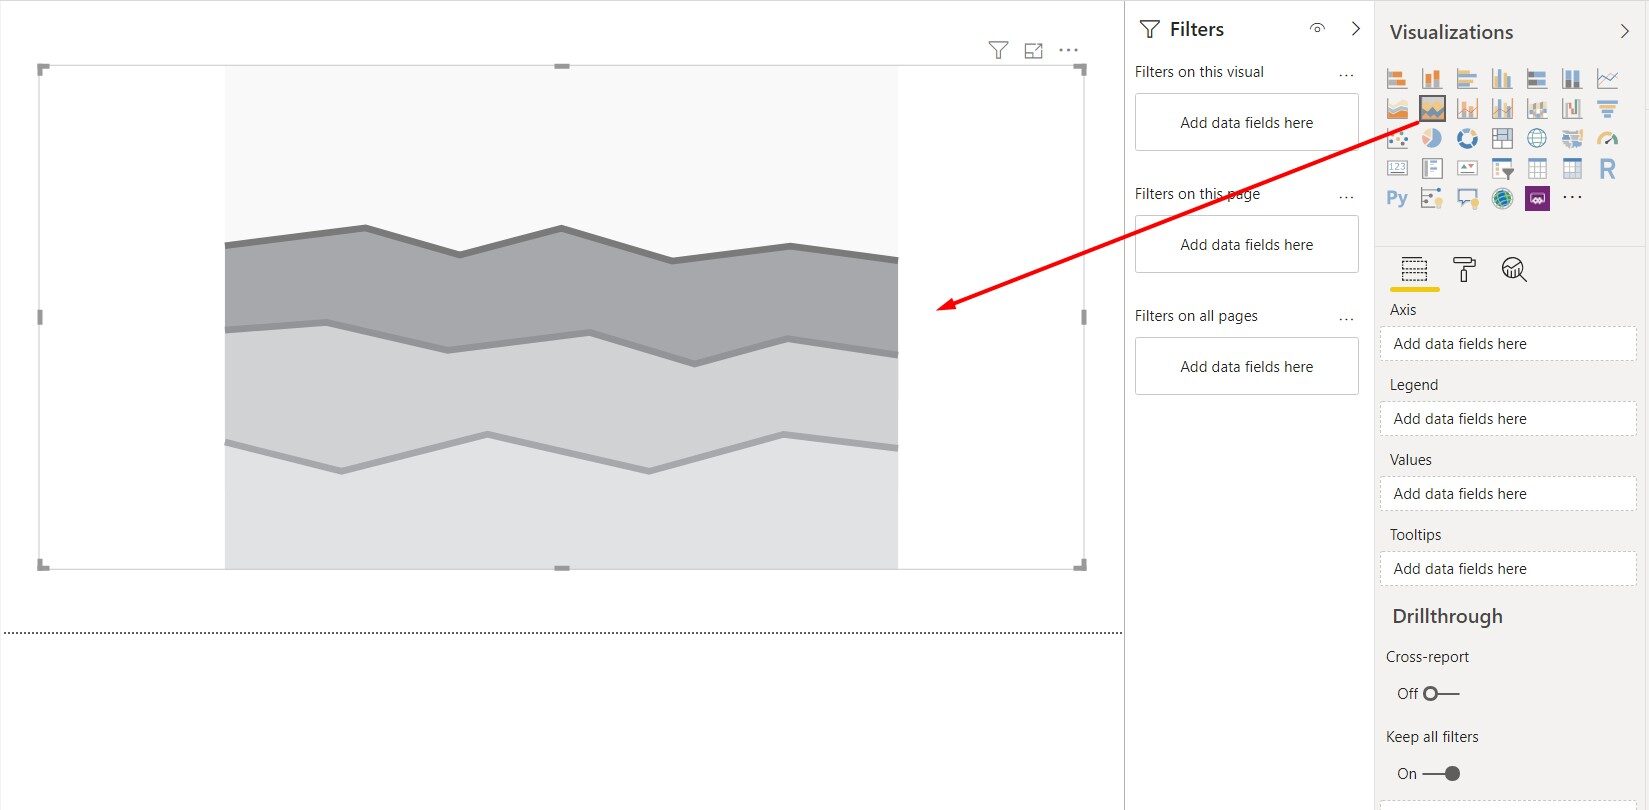
Then, we made some configuration changes.
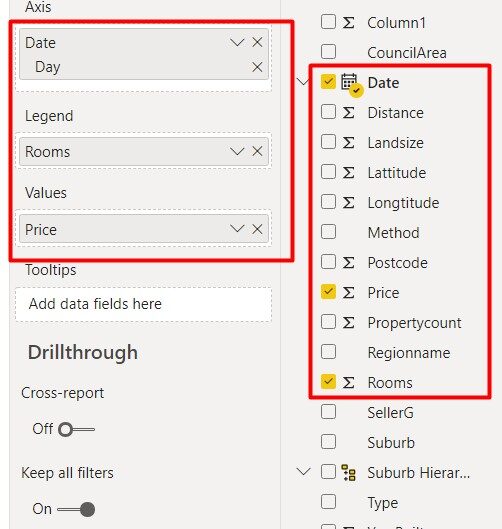
The day of the month is taken from the date, the price consists of the values and the number of rooms in the house is the legend. This will show the number of bedroom houses that are sold on a particular date of the month.
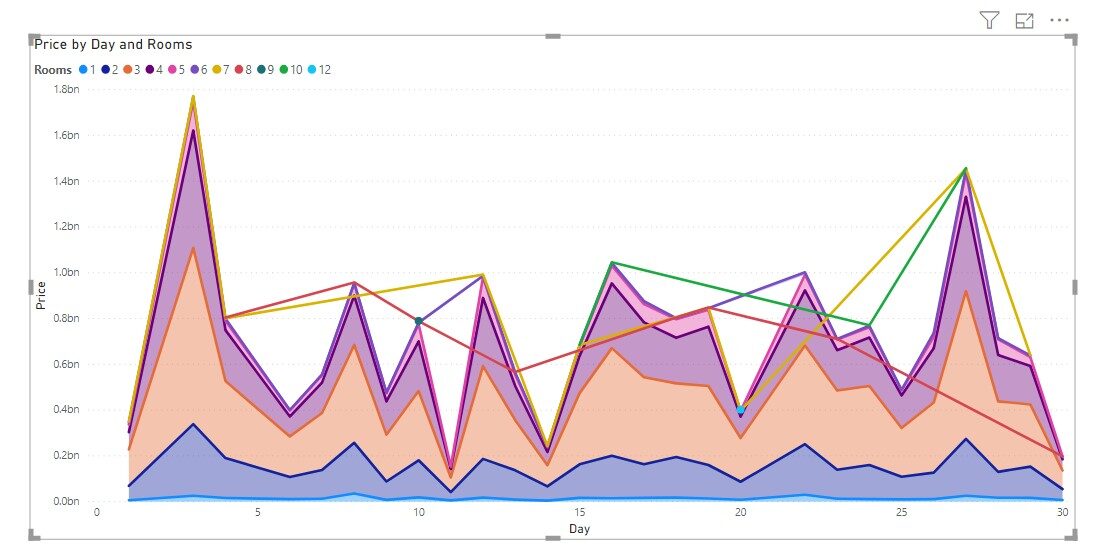
The graphic produced.
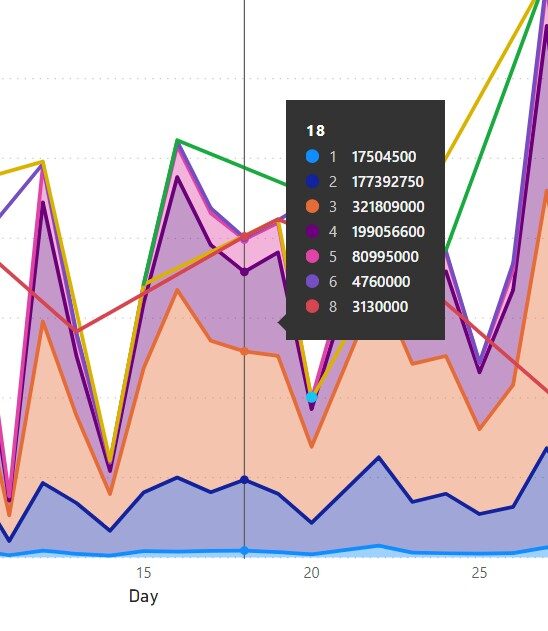
In focus mode, we can correctly understand the values and analyze the data. There are many other types of charts and visuals in Power BI that make the analysis process easy and simple..
Integration with various other tools
Power BI integrates very well not only with Microsoft tools such as Office 365, Dynamics 365 y Sharepoint, but also with non-Microsoft tools like Spark, Hadoop, Google Analytics, SAP, Salesforce, etc. This makes it widely usable throughout the industry..
Therefore, we can conclude that Power BI is a simple cloud-based BI software that is easy to use and can be used to improve business performance.. Its ability to work with almost all types of data makes it very popular in marketing, sales, analysis, strategy, human Resources, operations and other departments.
Personally, I have worked a lot with Power BI for various purposes and find using Power BI very simple and convenient.
I spoke at two online events in Power BI, can see them.
1. Microsoft student partners light the spark | Day 3 Timestamp: 22:24
2.The developers speak | Chapter 2 | Low code, without code Timestamp: 1:20:33
Microsoft Power BI with a wealth of features, easy-to-use user interface and tools has truly been a data analytics powerhouse, and everyone who wants to get into data science or analytics should learn Microsoft Power BI.
Connect with me on Linkedin and follow me in my Github.
Prateek Majumder.
The media shown in this article is not the property of DataPeaker and is used at the author's discretion.


