Business Analytics has become a keyword for anything that has to do with data.
Therefore, if you are new to this field and don't understand what people are referring to “Business analysis”, Avoid worrying!
Even after spending more than 6 years in this industry, There are times when it is difficult for me to understand the work that a person has done reading their CV.
This is what an excerpt from a typical JD would look like:
- Analyze, prepare reports and present them to the leadership team with a set frequency.
O
- Lead multiple analytical projects and business planning to help the leadership team deliver business performance.
On one side, this creates confusion in the mind of the person applying for a particular position. Besides, leaves selectors with a difficult role to understand and judge what a person has done in the past.
Now, if i got this as a description for one of the jobs i had applied to, I would be scared! Afraid, not because I don't know the subject, but because they can mean anything. The work could refer to the preparation of basic reports at a junior level to conduct multivariate deep dives on multiple topics.
Then, What do you do when you are in such a situation?
Good, The first thing to do is understand the spectrum of Business Analytics. Once you understand, ask which part of the spectrum the role applies to and then decide if it suits your abilities or not.
Below is a good representation of this spectrum:
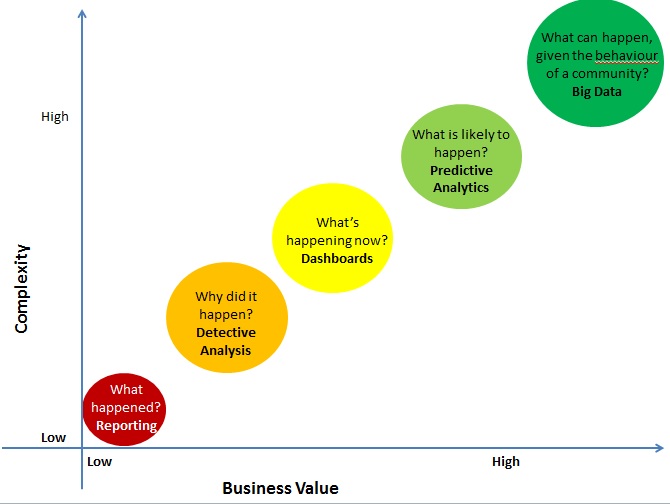
Let me explain each of these areas in a little more detail..
Reports: answer to what happened?
The Analytics domain starts with answering a simple question: What happened? This activity is regularly referred to as reports. As usual, these are the MIS that people want to receive first thing in the morning. It is a snapshot of what happened. Then, shows an example of what a typical report would look like:

Tools used in reporting:
Most elementary reports are done in MS Excel all over the world. The most evolved institutions can extract the data through databases using tools such as SQL, MS Access u Oracle. But, as usual, the dissemination of reports is done by means of Excel.
Skills required to report:
- MS Excel
- Business understanding
- Ability to perform monotonous tasks with diligence.
Detective analysis: answer to Why did it happen?
Detective Analysis starts where reporting ends. Start looking for reasons for unexpected changes. Typical problems you work on are “Why have sales declined in the last 2 months?” O “Why did the last campaign underperform or underperform?”. To find answers to these questions, look at past trends or distribution changes to find out the reasons for the changes. Despite this, this is all retrospective.
Some of these ideas, What you discover after parsing the backward analysis, can be used for business planning, but the purpose of the analysis is usually to find out what has worked and what has not.
Tools used in detective analysis:
The most used tools are MS excel, MS Access, Minitab, R (basic regression). You often use advanced Excel and pivot tables to fix these problems and, as usual, creating time series charts helps a lot.
Indispensable skills for detective analysis:
- Structured thinking
- MS Access, Excel, basic regression
- Business understanding
Control panels: response to what is happening now?
The dashboard is an organized and well-presented summary of key business metrics. They are generally interactive so that the user can find the exact information they are looking for. The board, in ideal state, must provide real-time information on performance. Then, shows an example of what a board would look like:
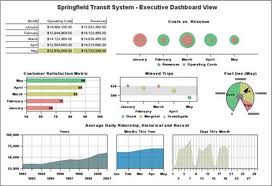
The whole science of data modeling, dashboards and reports based on this data is also known as “Business Intelligence“.
Tools used to create dashboards:
For a limited data size, dashboards can be created with advanced Excel. But, as usual, institutions use more advanced tools for the creation and dissemination of tools. Business Objects, Qlikview, Hyperion are names of some of these softwares.
Essential skills for creating dashboards:
- Strong structured thinking: the person will need to create the entire architecture and data model
- Business understanding: if you don't understand what you want to represent, God help you!
Predictive modeling – Answer to What is likely to happen?
This is where you take all your trends and historical information and apply them to predict the future.. Try to predict customer behavior based on past information. Note that there is a little difference in forecasting and predictive modeling. Forecasting is done regularly at the aggregate level, while predictive modeling is regularly done at the customer level / instance.
Tools used for predictive modeling:
SAS has the highest market share among tools used for predictive modeling, followed by SPSS, R, Matlab.
Essential skills for predictive modeling:
- Strong structured thinking
- Business understanding
- Problem resolution
Big data – Answer to What can happen, given the behavior of the community?
Imagine applying predictive modeling with a microscope in hand. What if you can store, analyze and make sense of each customer information? What type of social media community are you linked to? What kind of searches are you doing? Big data problems arise when data has grown in the three Vs (volume, speed and variety). You need data scientists to extract this data.
Tools used in Big Data:
This is a very dynamic domain at the moment. A tool that used to be a market leader makes 6 months is no longer the best. Therefore, it is difficult to specify specific tools. These tools usually work in Hadoop to save the data.
Essential skills to take advantage of Big Data:
- Strong structured thinking
- Advanced knowledge of data architecture
- Ability to work with unstructured data.
Then, Now that you understand the spectrum of Analytics, if you find yourself in a role that is not clear to you, take the time to understand which domain you are referring to and if it fits well with what you want to achieve.
If you have encountered this confusion about understanding “Business analysis“, This post should have helped you. In case there is more confusion, let me know.


