
This article was published as part of the Data Science Blogathon.
Introduction
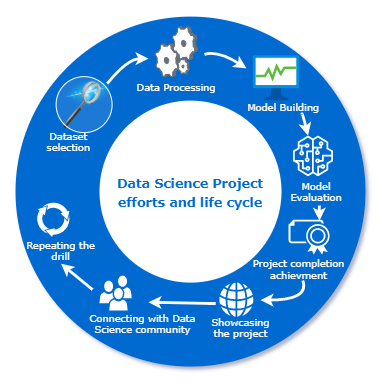
Steps for your first data science project
In this article, Let's look at some tips you can use to get started on your personal data science projects..
1. Choose a data set
If you are taking on the data science project for the first time, choose a dataset of your interest. May be related to sports, movies or music, anything that interests you. The most common websites to obtain the data are:
For those who have already done one or two projects, end to end on your own, following the above guidelines, can target the analysis of a complex data set from a particular domain such as retail, finance or healthcare to get an idea of projects in real time.
to get started, had selected a set of health insurance data to practice predictive analytics. I pulled the dataset from the Kaggle website
! pip install -q kaggle
#from google.colab import files
#files.upload()
! mkdir ~/.kaggle
! cp kaggle.json ~/.kaggle/
! chmod 600 ~/.kaggle/kaggle.json
#! kaggle datasets download -d mirichoi0218/insurance
#! unzip insurance.zip -d health-insurance
! kaggle datasets download -d mirichoi0218/insurance
! unzip insurance.zip -d health-insurance
2. Choose an IDE
Select an IDE that you are most comfortable with. If you are using Python as a language, here are some examples
- – It is an IDE designed to write Python codes. Provides various productive functions such as routine care, smart code completion, error checking and code correction. Facilitates project maintenance by providing integration with version control functions, supports web development and data science.
- Jupyter Notebook – It is an open source web application that allows you to create and share documents containing live code, equations and visualization. Helps streamline work and facilitate collaborations
- Google Colab – Allows users to write and run Python code. It is very suitable for data science and machine learning projects, since it offers computational resources for free. You can run heavy machine learning algorithms here with ease without having to worry about infrastructure or costs.
- Simple text file with extension .py: although the above options are available and easy to use, if you feel more comfortable with notepad to write your code, you can use it and save your file with the extension .py. Then you can run the same using a command line with syntax like "python <> .py. This will run your program, but for data science jobs, this might not be the best option, since you can't see the code output or visualizations on the fly.
I selected Google Colab as the work environment.
3. Clearly list activities
Make a list of the activities you want to do in the dataset to have a clear path before you start. Common activities we do in data science projects are data ingestion, data cleaning, data transformation, exploratory data analysis, model building, model evaluation and model implementation. Here is a brief about all these steps.
- Data ingestion – It is a process of reading the data in a data frame.
###Panda package makes it easy to read a file into a dataframe

#Importing the libraries
import pandas as pd
import matplotlib.pyplot as plt
import seaborn as sns
from matplotlib.cbook import boxplot_stats
import statsmodels.api as sm
from sklearn.model_selection import train_test_split,GridSearchCV, cross_val_score, cross_val_predict
from statsmodels.stats.outliers_influence import variance_inflation_factor
from sklearn.tree import DecisionTreeRegressor
from sklearn import ensemble
import numpy as np
import pickle

#Reading and summarizing the data
health_ins_df = pd.read_csv("health-insurance/insurance.csv")
health_ins_df.columns
health_ins_df.shape
health_ins_df.describe()
- Data cleansing – It is the process of identifying and eliminating anomalies in the data set.
- Data transformation – It involves changing the data type of the columns, create derived columns or remove duplicate data, to name a few.
- Exploratory data analysis – Perform univariate and multivariate analyzes on data sets to find hidden information and patterns in them.
I dedicated myself to data cleansing and exploratory data analysis of numerical and categorical variables on separate days to focus on the details..
#Visualizing age column with a histogram
fig,axes=plt.subplots(1,2,figsize=(10,5))
sns.histplot( health_ins_df['age'] , color="skyblue",ax=axes[0])
sns.histplot( health_ins_df['bmi'] , color="olive",ax=axes[1])
plt.show()
#Visualizing age column with a boxplot
fig,axes=plt.subplots(1,2,figsize=(10,5))
sns.boxplot(x = 'age', data = health_ins_df, ax=axes[0])
sns.boxplot(x = 'bmi', data = health_ins_df, ax=axes[1])
plt.show()
#Finding the outlier values in the bmi column
outlier_list = boxplot_stats(health_ins_df.bmi).pop(0)['fliers'].tolist()
print(outlier_list)
#Finding the number of rows containing outliers
outlier_bmi_rows = health_ins_df[health_ins_df.bmi.isin(outlier_list)].shape[0]
print("Number of rows contaning outliers in bmi : ", outlier_bmi_rows)
#Percentage of rows which are outliers
percent_bmi_outlier = (outlier_bmi_rows/health_ins_df.shape[0])*100
print("Percentage of outliers in bmi columns : ", percent_bmi_outlier)
#Converting age into age brackets
print("Minimum value for age : ", health_ins_df['age'].min(),"nMaximum value for age : ", health_ins_df['age'].max())
#Age between 18 to 40 years will fall under young
#Age between 41 to 58 years will fall under mid-age
#Age above 58 years will fall under old age
health_ins_df.loc[(health_ins_df['age'] >=18) & (health_ins_df['age'] <= 40), 'age_group'] = 'young'
health_ins_df.loc[(health_ins_df['age'] >= 41) & (health_ins_df['age'] <= 58), 'age_group'] = 'mid-age'
health_ins_df.loc[health_ins_df['age'] > 58, 'age_group'] = 'old'

fig,axes=plt.subplots(1,5,figsize=(20,8))
sns.countplot(x = 'sex', data = health_ins_df_clean, palette="magma",ax=axes[0])
sns.countplot(x = 'children', data = health_ins_df_clean, palette="magma",ax=axes[1])
sns.countplot(x = 'smoker', data = health_ins_df_clean, palette="magma",ax=axes[2])
sns.countplot(x = 'region', data = health_ins_df_clean, palette="magma",ax=axes[3])
sns.countplot(x = 'age_group', data = health_ins_df_clean, palette="magma",ax=axes[4])
heatmap = sns.heatmap(health_ins_df_clean.corr(), vmin=-1, vmax=1, annot=True)
sns.relplot(x="bmi", y ="charges",hue="sex", style = "sex", data=health_ins_df_clean);
sns.boxplot(x="smoker", y ="charges", data=health_ins_df_clean)
- Construction of the model – Try and test all possible models in the dataset before choosing the correct one based on business limitations / techniques. During this phase, you can also try some bagging or reinforcing techniques.
I first developed a base model, before testing any advanced models on the dataset
#Data Pre-processing
#Converting categorical values into dummies using one-hot encoding technique
health_ins_df_processed = pd.get_dummies(health_ins_df_clean, columns=['sex','children','smoker','region','age_group'], prefix=['sex','children','smoker','region','age_group'])
health_ins_df_processed.drop(['age'],axis = 1,inplace=True)
#Building linear regression model
X = health_ins_df_processed.loc[:, health_ins_df_processed.columns != 'charges']
y = health_ins_df_processed['charges']
X_train, X_test, y_train, y_test = train_test_split(X, Y, test_size=0.33)
X = sm.add_constant(X) # adding a constant
model = sm.OLS(Y, X).fit()
predictions = model.predict(X)
print_model = model.summary()
print(print_model)
#Final model after eliminating variable with least significance and high vif
X = health_ins_df_processed[['bmi','children_0', 'smoker_yes',  'region_southeast', 'region_southwest', 'age_group_old', 'age_group_young']]
y = health_ins_df_processed['charges']
X_train, X_test, y_train, y_test = train_test_split(X, Y, test_size=0.33)
X = sm.add_constant(X) # adding a constant
model = sm.OLS(Y, X).fit()
predictions = model.predict(X)
print_model = model.summary()
print(print_model)
- Model evaluation – In this phase, we test if our model is good enough to get an expected result. We measure precision, specificity, sensitivity or adjusted R-squared according to the model we have used
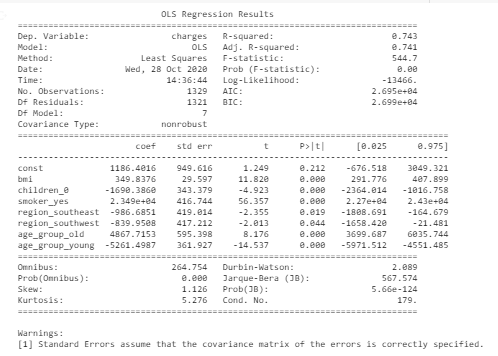
This is the final evaluation metric of the base model that shows a 74% precision and 7 significant variables (p value <significance value)
4. Complete the tasks one by one
At this stage, you should have an idea of what activities to do in your project. You can take them one by one. Not necessarily, you have to complete everything in one day. It may take up to 1 day of time to decide which dataset you want to work on and what environment you are comfortable with.
Can dedicate the day 2 understand data and perform data cleansing activities. In the same way, you can aim to complete your project in a span of 7-8 days.
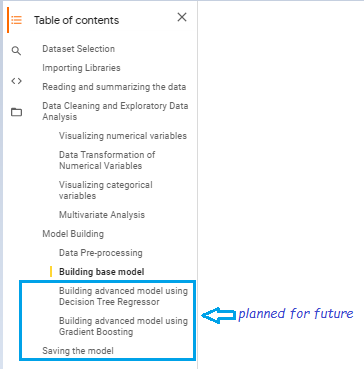
I have done this project in a span of 4 days. I have planned to test some more advanced models to increase predictive performance
5. Prepare a summary
I will be preparing a short summary after this project is completed.
6. Share it on open source platforms
Choose an open source platform where you want to post the project brief or codes so you can gain visibility in the data science community and connect with other enthusiasts. GitHub is more commonly used these days. There are few websites like Kaggle, Google Colab offering inline kernels so you can write code and run without having to worry about infrastructure. You can also take advantage of these platforms.
The source code is available in my GitHub bill
The advantages of assuming projects in stages
1. There is no pressure to complete the project all in one day.
2. You can focus on only one specific task in a day and can complete it efficiently.
3. Will keep you glued to tasks until done
4. The project summary can be referenced in the future while preparing for interviews or doing similar types of projects..
5. You can take advantage of this project to connect with other data science enthusiasts and share creative ideas..
I learned that we must follow a disciplined approach to learning and invest our time doing projects. We all learn more, doing things in a practical way. As a last resort, it is hard work and perseverance that will lead you down the path you have always dreamed of paving.





