Introduction
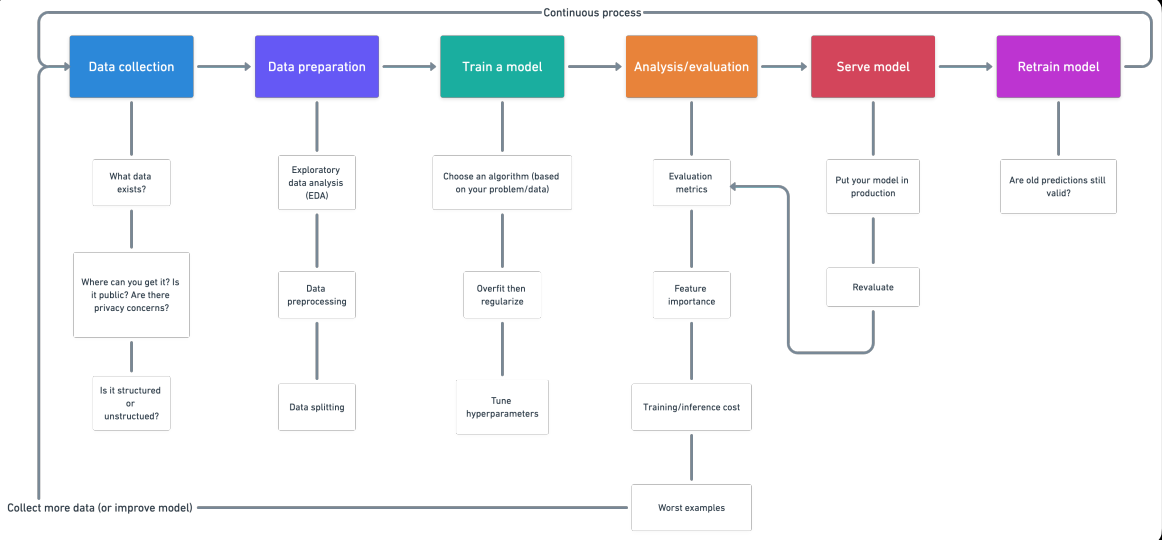
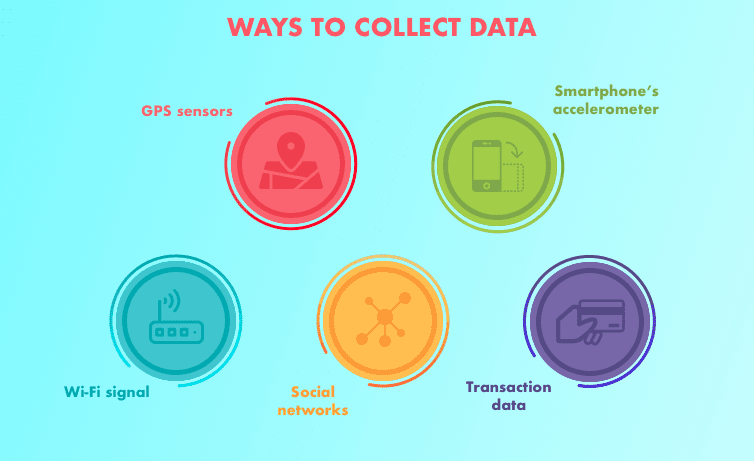
1. Data collection
- What kind of problem are we trying to solve?
- What data sources already exist?
- What privacy issues are there?
- Is the data public?
- Where should we store the files?
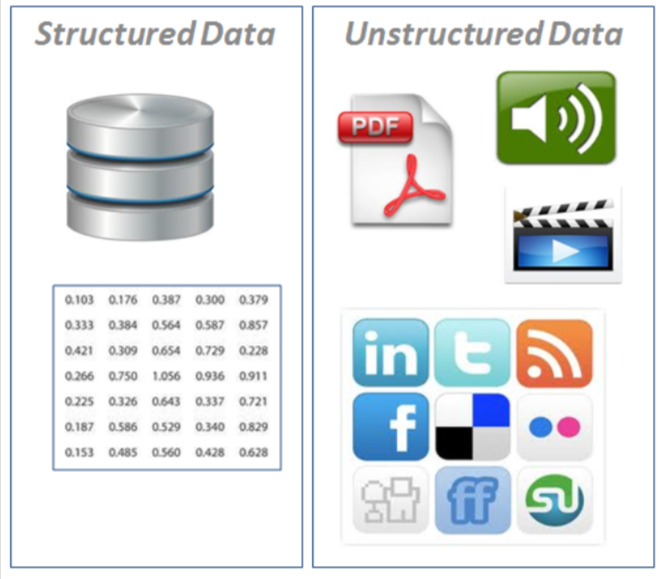
- Structured data: appear in tabular format (row and column style, like what you would find in an excel spreadsheet). Contains different types of data, for instance, numerical time series, categorical.
- · Nominal / categorical – One thing or another (mutually exclusive). For instance, for car scales, color is a category. A car can be blue but not white. An order does not matter.
- Numeric: Any continuous value where the difference between them matters. For instance, when selling houses, $ 107,850 is more than $ 56,400.
- Ordinal: Data that have order but the distance between values is unknown. For instance, a question like, How would you rate your health from 1 al 5? 1 being poor, 5 healthy. Can you reply 1, 2, 3, 4, 5, but the distance between each value does not necessarily mean that a response of 5 is five times as good as an answer of 1. Time seriesA time series is a set of data collected or measured at successive times, usually at regular time intervals. This type of analysis allows you to identify patterns, Trends and cycles in data over time. Its application is wide, covering areas such as economics, Meteorology and public health, facilitating prediction and decision-making based on historical information....: data over time. For instance, historical sales values of bulldozers 2012 a 2018.
- Time series: Data over time. For instance, historical sales values of bulldozers 2012 a 2018.
- Unstructured data: Data without rigid structure (images, video, voice, natural
language text)
2. Data preparation
- Exploratory data analysis (EDA), learn about the data you are working with
- What are the characteristic variables (entry) and the variableIn statistics and mathematics, a "variable" is a symbol that represents a value that can change or vary. There are different types of variables, and qualitative, that describe non-numerical characteristics, and quantitative, representing numerical quantities. Variables are fundamental in experiments and studies, since they allow the analysis of relationships and patterns between different elements, facilitating the understanding of complex phenomena.... de destino (Exit)? For instance, to predict heart disease, characteristic variables may be age, the weight, a person's average heart rate and level of physical activity. And the objective variable will be whether or not they have a disease.
- What kind of do you have? Structured time series, unstructured, numerical. Missing values? In case you delete or complete them, the imputation function.
- Where are the outliers? How many of them are there? Why are they there? Are there any questions you can ask a domain expert about data? For instance, Could a heart disease physician shed some light on their heart disease dataset?
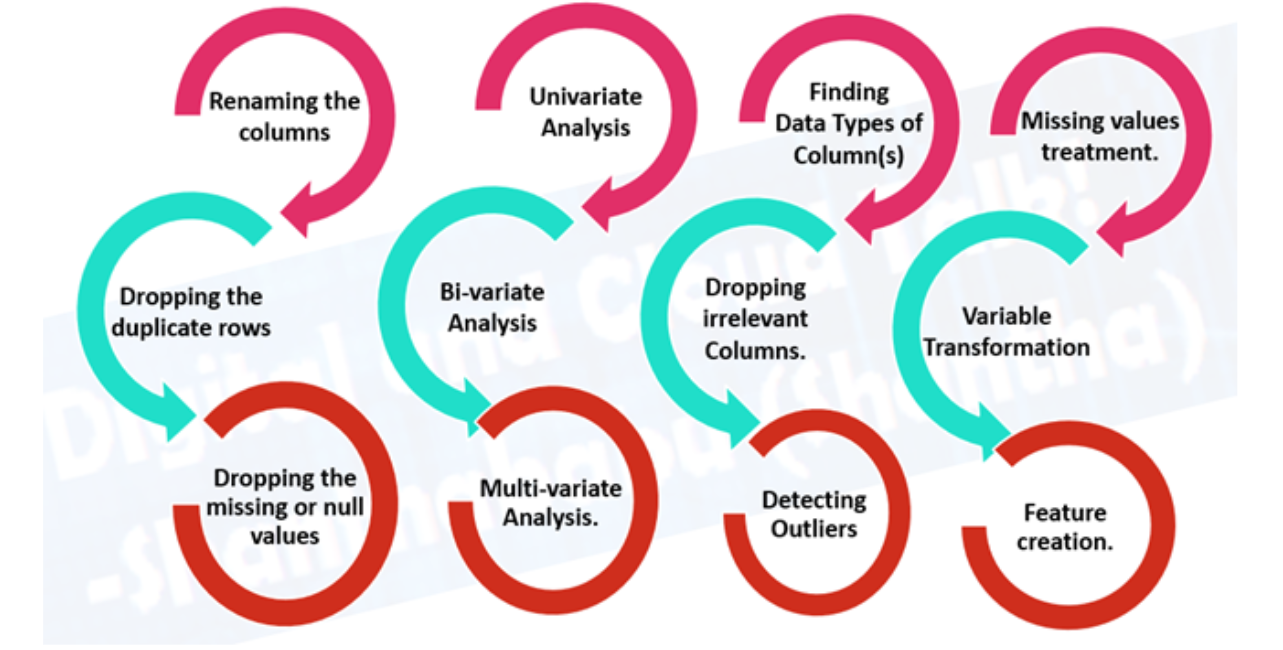
- Data preprocessing, preparing your data for modeling.
- Imputation function: fill in missing values (a machine learning model cannot learn
in data that is not there)
- Single imputation: Fill with media, a median of the column.
- Multiple imputations: Model other missing values and with what your model finds.
- KNN (k nearest neighbors): Fill in the data with a value from another example that is similar.
- Many more, like random imputation, the last observation carried out (for time series), the moving window and the most frequent.
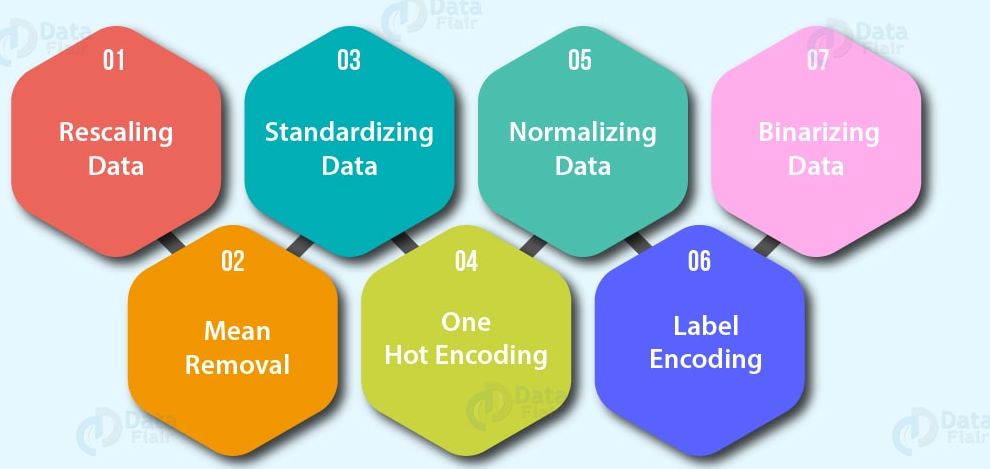
- Function coding (convert values to numbers). A machine learning model
requires all values to be numeric)
- A hot coding: Convert all unique values to lists of zeros and ones where the target value is 1 and the rest are zeros. For instance, when a car colors green, Red, blue, verde, the future of car color would be represented as [1, 0, and 0] and a serious red [0, 1, and 0].
- Label encoder: Convert labels to distinct numeric values. For instance, if your target variables are different animals, like a dog, cat, bird, these could become 0, 1 Y 2, respectively.
- Embed coding: Learn a representation between all the different data points. For instance, a language model is a representation of how different words relate to each other. Embedding is also increasingly available for structured data (tabular).
- NormalizationStandardization is a fundamental process in various disciplines, which seeks to establish uniform standards and criteria to improve quality and efficiency. In contexts such as engineering, Education and administration, Standardization makes comparison easier, interoperability and mutual understanding. When implementing standards, cohesion is promoted and resources are optimised, which contributes to sustainable development and the continuous improvement of processes.... de funciones (scaled) or standardization: When numerical variables are on different scales (for instance, the number_of_bathroom is between 1 Y 5 and the size_of_land between 500 Y 20000 square feet), some machine learning algorithms don't work very well. Scaling and standardization help solve this problem.
- Function engineering: transform the data into a representation (potentially) more meaningful by adding domain knowledge
- Decompose
- Discretization: convert large groups into smaller groups
- Crossing and interaction functions: combination of two or more functions
- The characteristics of the indicator: use other parts of the data to indicate something potentially significant
- Feature selection: selecting
the most valuable characteristics of your dataset to model. Potencialmente reduciendo el tiempo de trainingTraining is a systematic process designed to improve skills, physical knowledge or abilities. It is applied in various areas, like sport, Education and professional development. An effective training program includes goal planning, regular practice and evaluation of progress. Adaptation to individual needs and motivation are key factors in achieving successful and sustainable results in any discipline.... y sobreajuste (less general data and less redundant data to train) and improving accuracy.
- Dimensionality reduction: A common method of dimensionality reduction, PCA or Principal Component Analysis takes a lot of dimensions (features) and use linear algebra to reduce them to fewer dimensions. For instance, suppose you have 10 numeric functions, I could run PCA to reduce it to 3.
- Importance of function (post modeling): Fit a model to a data set, then inspect which characteristics were most important to the results, remove the least important.
- Wrapping methods how genetic algorithms and recursive feature removal involve creating large subsets of feature options and then removing the ones that don't matter.
- Deal with imbalances: Does your data have 10,000 examples of a class but only 100 examples of another?
- Collect more data (yes can)
- Use the scikit-learn-contrib imbalanced package- learn
- Use SMOTE: synthetic minority oversampling technique. Create synthetic samples of your junior class to try to level the playing field.
- A useful item to look at is “Learning from unbalanced data”.
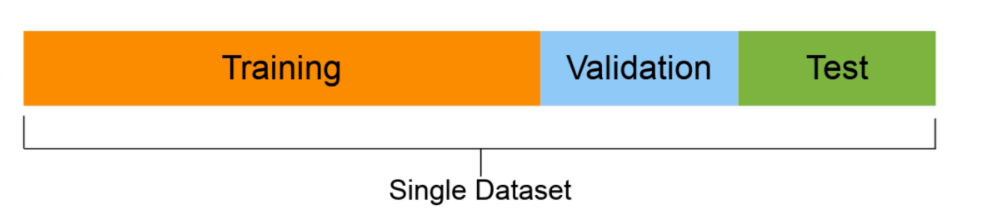
- Training set (generally 70-80% of the data): the model learns about this.
- Validation set (normally from 10 al 15% of the data): the model hyperparameters conform to this
- Test set (normally between 10% and the 15% of the data): the final performance of the models is evaluated on this basis. If you have done well, hopefully the test set results give a good indication of how the model should work in the real world. Do not use this data set to fit the model.
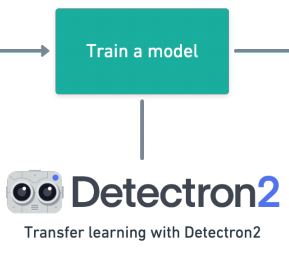
3. Train the model on the data (3 Steps: choose an algorithm, fit the model, reduzca el ajuste con regularizationRegularization is an administrative process that seeks to formalize the situation of people or entities that operate outside the legal framework. This procedure is essential to guarantee rights and duties, as well as to promote social and economic inclusion. In many countries, Regularization is applied in migratory contexts, labor and tax, allowing those who are in irregular situations to access benefits and protect themselves from possible sanctions....)
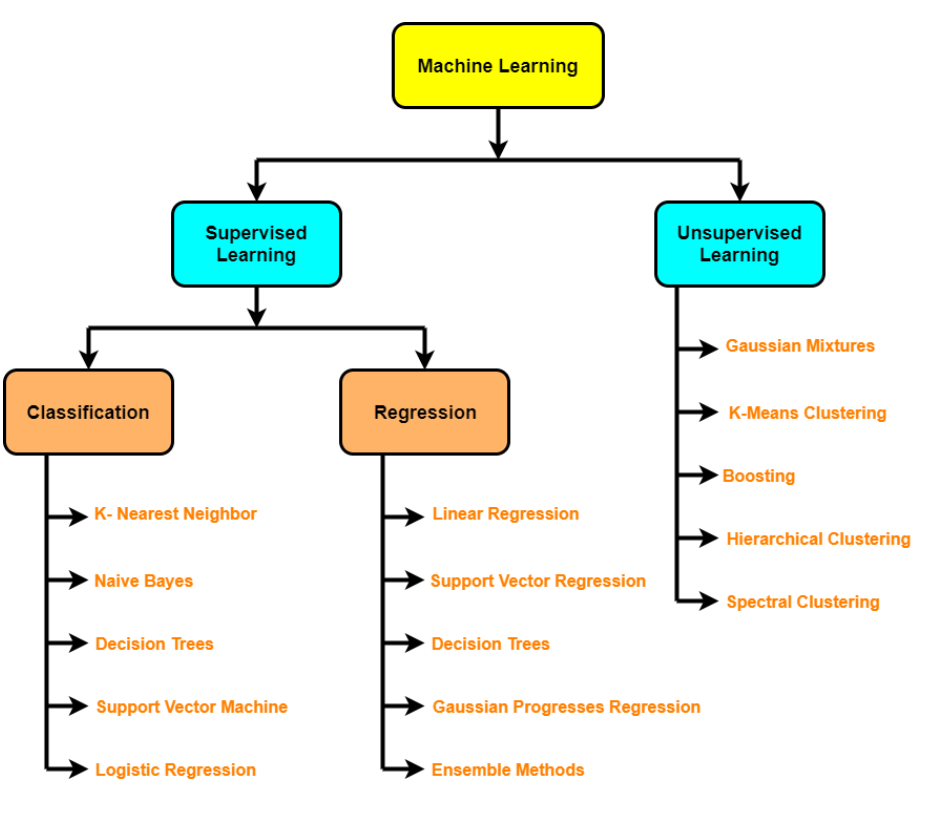
- Supervised algorithms: linear regression, Logistic regression, KNN, SVM, decision tree and random forests, AdaBoost / Gradient Boosting Machine (impulse)
- Unsupervised algorithms: groupingThe "grouping" It is a concept that refers to the organization of elements or individuals into groups with common characteristics or objectives. This process is used in various disciplines, including psychology, Education and biology, to facilitate the analysis and understanding of behaviors or phenomena. In the educational field, for instance, Grouping can improve interaction and learning among students by encouraging work.., dimensionality reduction (PCA, automatic encoders, t-SNE), anomaly detection
- Batch learning
- Learn online
- Transfer learning
- Active learning
- Assembly
- Maladjustment – occurs when your model does not perform as well as you would like on your data. Try training for a longer or more advanced model.
- Over-adjustment– occurs when the loss of validation begins to increase or when the model performs better in the training set than in the test set.
- Regularization: a collection of technologies to prevent / reduce overfitting (for instance, L1, L2, Abandonment, Early stop, Data augmentation, Batch normalization)
- Hyperparameter tuning – Run a bunch of experiments with different settings and see which one works best
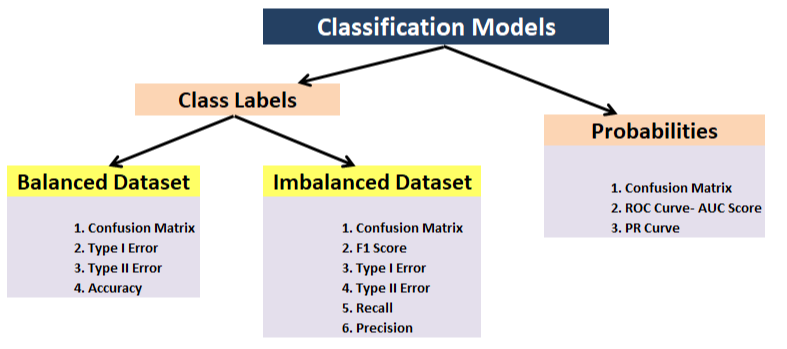
4. Analysis / Evaluation
- Classification: precision, precision, Recovery, F1, confusion matrix, mean mean precision (object detection)
- Regression – MSE, MUCH, R ^ 2
- Task-based metric: for instance, for the autonomous car, you may want to know the number of disconnections
- Importance of the feature
- Training / inference time / cost
- What if the tool: how my model compares to other models?
- Less safe examples: Where is the model wrong?
- Bias compensation / variance
5. Service model (implementation of a model)
- Put the model in production and see how it goes.
- Instruments that you can use: TensorFlow Servinf, PyTorch Serving, Google AI Platform, Sagemaker
- MLOps: where software engineering meets machine learning, essentially all the technology required around a machine learning model to make it work in production

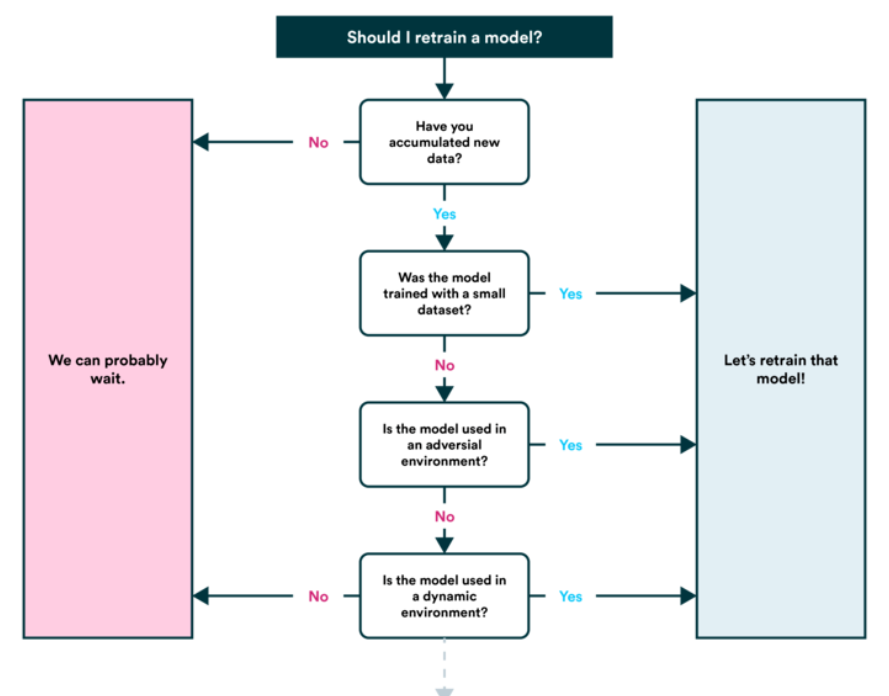
6. Retrain Model
- See how the model works after publishing (or before publication) based on various evaluation metrics and revisit previous steps as needed (remember, machine learning is very experimental, so this is where you will want to keep track of your data and experiments.
- You will also find that your model predictions start to 'age’ (generally not in a fancy style) the ‘derive, such as when data sources change or are updated (new hardware, etc.). This is when you will want to train him again.
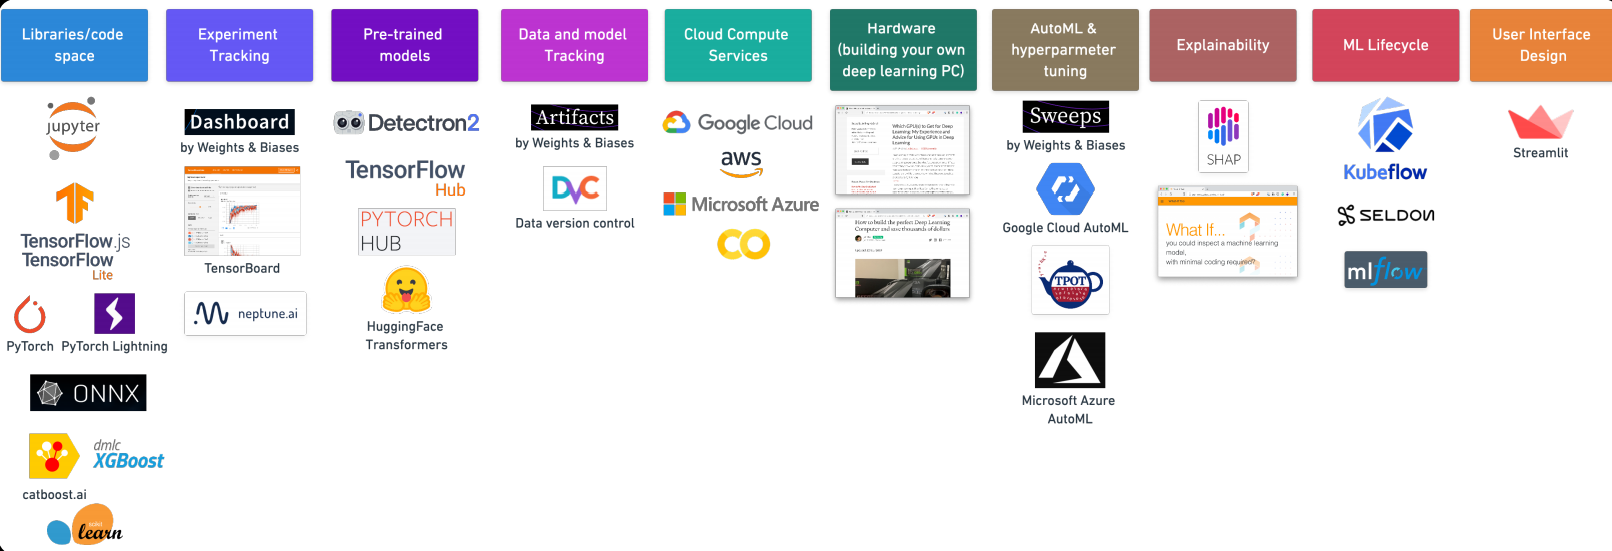
7. Machine learning tools
Thanks for reading this. If you like this article, Share it with your friends. In case of any suggestion / doubt, comment below.
Email identification: [email protected]
Follow me on LinkedIn: LinkedIn
The media shown in this article is not the property of DataPeaker and is used at the author's discretion.


