
This article was published as part of the Data Science Blogathon.
Introduction
Tkinter overview
Python provides a standard GUI library called Tkinter. The Tkinter module helps to create GUI applications in a quick and easy way. Tkinter provides 15 widget types. Some of the most common are Button, Label, Marco, Menu. The message, radio button, the text, the scroll bar, etc. You can read more about this here Y here.
In this article. we will create a small numbers game. The user will continue to receive numerical questions. They will answer them and click Enter to go to the next question until they decide to exit and process the result.. Correct and incorrect answers will be captured to show the result at the end. We will use widgets like Label, End, Entry, Text, Button. Let's get started with the deployment without further ado.
Implementation
1. Import packages
As usual, it's a good idea to keep all imports separate. At least, I like it so!
import tkinter
import random
from random import randint
from tkinter import Button
import matplotlib.pyplot as plt
import numpy as np
2. Creating a GUI window and declaring global variables
We will create the interface design. Decide on the size of the layout and an attractive title
root = tkinter.Tk()
root.title("Are you smart!!")
root.geometry("400x200")
correct_result=0
correct_answers=0
total_questions=0
incorrect_answer=0
3. Function to evaluate the result
We will create small definitions to perform tasks that make the code easy to maintain and clean to read.
def evaluate(event):
    global correct_result
    global user_input
    user_input_given = user_input.get()
    if str(user_input_given) == str(correct_result):
        global correct_answers
        correct_answers += 1
        nextQuestion()
    else:
        global incorrect_answer
        incorrect_answer += 1
        result = tkinter.Label(root, text="Hard Luck!!nThe correct answer is : "+str(correct_result), font=('Helvetica', 10))
        result.pack()
        nextQuestion()
        root.after(1500, result.destroy)
4. Function to create a question
We will use random to create a random integer and a random choice for the '+' operator, ‘-‘ and '*’ so users can get random sets of numerical questions to answer
def nextQuestion():
    user_input.focus_set()
    user_input.delete(0, tkinter.END)
    global first_num
    first_num = randint(1,15)
    global second_num
    second_num = randint(1,15)
    global character
    character = random.choice("+-*")
    global correct_result
    if character == '*':
        correct_result = first_num*second_num
    if character == '+':
        correct_result = first_num+second_num
    if character == '-':
        correct_result = first_num-second_num
    text="Enter the value of "+str(first_num)+" "+character+" "+str(second_num)
    global total_questions
    total_questions += 1
    user_question.config(text=text)
    user_question.pack()
5. Exit function
We will create a small function to exit and interact and record the results.
def exitThis():
    print("Total Questions attended : "+str(total_questions))
    print("Total Correct Answers : "+str(correct_answers))
    print("Total Incorrect Answers : "+str(incorrect_answer))
    root.destroy()
6. Initial question
We will create an initial set of questions based on a random integer and a random set of numerical operators
first_num = randint(1,15)
second_num = randint(1,15)
character = random.choice("+-*")
if character == '*':
    correct_result = first_num*second_num
if character == '+':
    correct_result = first_num+second_num
if character == '-':
    correct_result = first_num-second_num
7. Label creation
We will create the text and the interface design.
user_question = tkinter.Label(root, text="Enter the value of "+str(first_num)+" "+character+" "+str(second_num), font=('Helvetica', 10))
user_question.pack()
user_input = tkinter.Entry(root)
root.bind('<Return>',evaluate)
user_input.pack()
user_input.focus_set()
exitButton = Button(root, text="EXIT and Check Result", command=exitThis)
exitButton.pack(side="top", expand=True, padx=4, pads = 4)
8. Start the GUI
root.mainloop()
9. Results display
Usaremos una barra y un pie chartThe pie chart, Also known as pie chart, is a visual representation that shows the proportion of different parts to a whole. It is commonly used in statistics to illustrate the distribution of categorical data. Each section of the chart represents a percentage of the total, making it easier to compare between categories. Its clear and concise design makes it an effective tool for the presentation of quantitative information.... para mostrar el resultado a los usuarios después de que decidan salir del juego.
#Plotting the bar graph
plt.figure(0)
objects = ('Total Number of Questions','Correct Answers','Incorrect answers')
y_pos = np.arange(len(objects))
stats = [total_questions,correct_answers,incorrect_answer]
plt.bar(y_pos, stats, align='center', alpha=0.5)
plt.xticks(y_pos, objects)
plt.ylabel('Numbers')
plt.title('Your Result!')
#Plotting the pie chart
if str(total_questions) != "0":
plt.figure(1)
labels="Correct Answers",'Incorrect answers'
sizes = [correct_answers,incorrect_answer]
colors = ['green', 'red']
explode = (0.1, 0) # explode 1st slice
plt.pie(sizes, explode=explode, labels=labels, colors=colors,
autopct="%1.1f%%", shadow=True, startangle = 140)
plt.axis('equal')

#Show both the graphs
plt.show()
Conclution
If you have come this far, He must have been really intrigued! Then, this is what it looks like finally
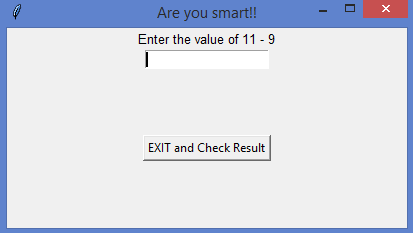
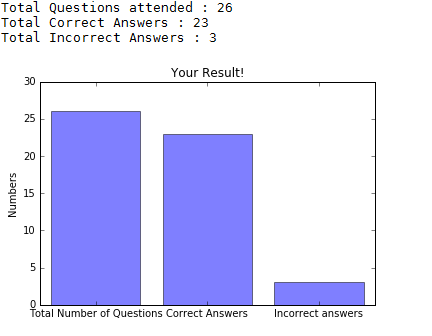
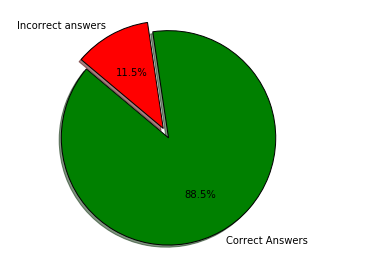
Share your thoughts if this article was interesting or helped you in any way. Always open to improvements and suggestions. You can find the code in Github
The media shown in this article is not the property of DataPeaker and is used at the author's discretion.





