
Dynamic tables: the swiss army knife of data analysis
I love how fast I can analyze data using pivot tables. With a click of my mouse, I can drill down to the granular details about a certain product category, or zoom out and get a high-level overview of the available data.
Pivot tables offer me a lot of flexibility as a data scientist. I will be honest: I rely heavily on them during the exploratory data analysis phase of a data science project.
Excel users will be intimately familiar with these pivot tables. They are the most used feature of Excel, And it's easy to see why! But did you know that you can build these pivot tables using Pandas in Python?

That's right! The wonderful Pandas library offers a function called pivot_table that summarizes the values of a feature in a neat two-dimensional table.. Veremos cómo construir una dynamic tablePivotTable is a powerful tool in spreadsheet programs, such as Microsoft Excel and Google Sheets. Allows you to summarize, Analyze and visualize large volumes of data efficiently. Through its intuitive interface, users can rearrange information, apply filters and create custom reports, facilitating informed decision-making in various contexts, from the business field to academic research.... de este tipo en Python aquí.
Créame, very soon you will be using these pivot tables in your own projects. Please note that this tutorial assumes basic knowledge of Pandas and Python. If you are new to these topics, you can pick them up in the free courses below:
Table of Contents
- Exploring the Titanic dataset with Pandas in Python
- Build a pivot table using Pandas
- ¿Cómo agrupar datos usando el indexThe "Index" It is a fundamental tool in books and documents, which allows you to quickly locate the desired information. Generally, it is presented at the beginning of a work and organizes the contents in a hierarchical manner, including chapters and sections. Its correct preparation facilitates navigation and improves the understanding of the material, making it an essential resource for both students and professionals in various areas.... in the pivot table?
- How to execute a pivot with a multiple index?
- Different aggregation function for different characteristics.
- Agregue características específicas con parametersThe "parameters" are variables or criteria that are used to define, measure or evaluate a phenomenon or system. In various fields such as statistics, Computer Science and Scientific Research, Parameters are critical to establishing norms and standards that guide data analysis and interpretation. Their proper selection and handling are crucial to obtain accurate and relevant results in any study or project.... of values
- Find the relationship between the characteristics with the columns parameter
- Handling missing data
Exploring the Titanic dataset using Pandas in Python
I'm sure you've come across the Titanic dataset on your data science journey. It is one of the first data sets we collect when we are ready to explore a project.. I will use it to show you the efficacy of dynamic table function.
We import the relevant libraries:
import pandas as pd
import numpy as np
import matplotlib.pyplot as plt
plt.style.use('ggplot')
For all those who forgot what the Titanic dataset looks like, I present to you the dataset!
df = pd.read_csv('drive/My Drive/AV/train.csv')
df.head()

I will leave some functions to facilitate the analysis of the data and demonstrate the capabilities of the dynamic table function:
df.drop(['PassengerId','Ticket','Name'],inplace=True,axis=1)
Time to build a pivot table in Python using the amazing Pandas library!! We will explore the different facets of a pivot table in this article and create an amazing and flexible pivot table from scratch.
How to group data using index on a pivot table?
- dynamic table requires a data and a index parameter
- data is the Pandas data frame that passes to the function
- index is the function that allows you to group your data. The index function will appear as an index on the resulting table.
I will be using the 'Sex’ column like the index for now:
#a single index
table = pd.pivot_table(data=df,index=['Sex'])
table

We can instantly compare all characteristic values for both genders. Now, let's visualize the finding:

Good, female passengers paid significantly more for tickets than males.
You can get more information on how to view your data here.
How to execute a pivot with a multiple index?
You can even use more than one function as an index to group your data. This increases the level of granularity in the resulting table and you can be more specific with your findings:
#multiple indexes
table = pd.pivot_table(df,index=['Sex','Pclass'])
table

Using multiple indices in the dataset allows us to agree that the disparity in the ticket fare for woman Y masculine passengers was valid in all Pclass on the titanic.
Different aggregation function for different characteristics.
The values shown in the table are the result of the summary that aggfunc applies to function data. aggfunc is a Added FunctionThe aggregate function is a key concept in economics that represents the relationship between the total production of goods and services in an economy and the price level. This function helps to understand how aggregate supply and demand vary in response to changes in factors such as fiscal and monetary policy. Its analysis is essential for the formulation of economic strategies and the prediction of economic cycles.... that dynamic table applies to your grouped data.
Default, it is np.mean (), But you can also use different add-on functions for different features!! Simply provide a dictionary as input to the aggfunc parameter with function name as key and corresponding aggregate function as value.
I will use np.mean () For him 'Age’ characteristic and np.sum () For him ‘Survived’ characteristic:
#different aggregate functions
table = pd.pivot_table(df,index=['Sex','Pclass'],aggfunc={'Age':np.mean,'Survived':np.sum})
table

The resulting table makes more sense when using different aggregation functions for different characteristics.
Add specific features with value parameters
But, What are you adding? You can tell Pandas the characteristics on which to apply the aggregate function, in the value parameter.
value The parameter is where it tells the function which features to add in. It is an optional field and if you do not specify this value, the function will add all numerical characteristics from the dataset:
table = pd.pivot_table(df,index=['Sex','Pclass'],values=['Survived'], aggfunc=np.mean)
table
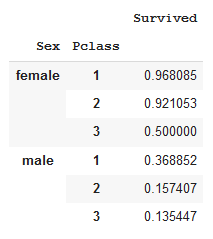
table.plot(kind='bar');
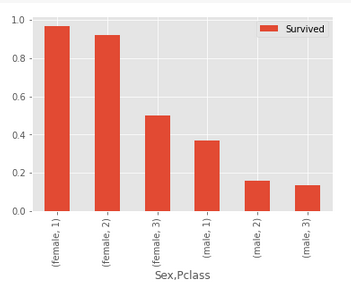
The survival rate of passengers on board the Titanic decreased with a degrading P-class between both sexes. What's more, the survival rate of male passengers was lower than that of women in any given P-class.
Find the relationship between the characteristics with the columns parameter
Using multiple functions as indexes is fine, but using some functions as columns will help you intuitively understand the relationship between them. What's more, the resulting table can always be better viewed by incorporating the columns parameter of the dynamic table.
This columns The parameter is optional and displays the values horizontally at the top of the resulting table.
Both of them columns and the index Parameters are optional, but its effective use will help you intuitively understand the relationship between the functions.
#columns
table = pd.pivot_table(df,index=['Sex'],columns=['Pclass'],values=['Survived'],aggfunc=np.sum)
table
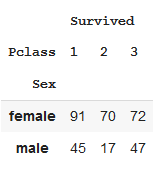
Using Pclass as a column is easier to understand than using it as an index:
table.plot(kind='bar');
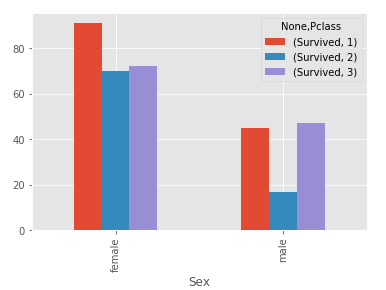
dynamic table it even allows you to deal with missing values through parameters drop Y fill_value:
- drop allows you to remove null values in clustered table whose values are null
- fill_value The parameter can be used to replace the NaN values in the clustered table with the values you provide here.
#display null values
table = pd.pivot_table(df,index=['Sex','Survived','Pclass'],columns=['Embarked'],values=['Age'],aggfunc=np.mean)
table

I will replace the NaN values with the mean value of the 'Age’ column:
#handling null values
table = pd.pivot_table(df,index=['Sex','Survived','Pclass'],columns=['Embarked'],values=['Age'],aggfunc=np.mean,fill_value=np.mean(df['Age']))
table

In this article, we explore the different parameters of the incredible dynamic table function and how it allows you to easily summarize the characteristics in your dataset through a single line of code.
If you are new to Python programming and want to learn more about analyzing data with Python, I recommend that you explore our Python for data science Y Pandas for data analysis in Python courses.





