
Spark is a data analysis engine that is mainly used for a large amount of data processing. It allows us to spread data and computational operations across multiple clusters to understand a significant performance increase.
Today, Spark is preferred by data scientists due to its various benefits over other data processing tools. Al usar Spark, the cost of collection, data storage and transfer decreases. When we work on a real life problem, we are likely to have large amounts of data to process. Therefore, the various engines distributed as Hadoop, Spark, etc. are becoming the main tools within the data science ecosystem.
PySpark
PySpark is a data analysis tool created by Apache SparkApache Spark is an open-source data processing engine that enables the analysis of large volumes of information quickly and efficiently. Its design is based on memory, which optimizes performance compared to other batch processing tools. Spark is widely used in big data applications, Machine Learning and Real-Time Analytics, thanks to its ease of use and... Community to use Python in conjunction with Spark. It allows us to work with RDD (Resilient Distributed Dataset)RDD (Resilient Distributed Dataset) is a fundamental abstraction in Apache Spark that enables efficient processing of large volumes of data. It is characterized by its ability to be fault-tolerant, Enabling recovery of lost data by rebuilding partitions. RDDs are immutable, Facilitating Parallelization of Operations and Improving Performance in Distributed Computing. Its use is essential for data analysis.. and DataFrames in Python. PySpark has numerous features that make it an amazing framework and when it comes to dealing with large amounts of data, PySpark gives us fast and real-time processing, flexibility, in-memory computing and various other features. It is a Python library to use Spark that combines the simplicity of the Python language with the efficiency of Spark.
Pyspark data frame
A DataFrame is a distributed collection of data in rows under named columns. In simple terms, we can say that it is the same as a table in a databaseA database is an organized set of information that allows you to store, Manage and retrieve data efficiently. Used in various applications, from enterprise systems to online platforms, Databases can be relational or non-relational. Proper design is critical to optimizing performance and ensuring information integrity, thus facilitating informed decision-making in different contexts.... or an Excel sheet with column headers. DataFrames are primarily designed to process a large-scale collection of structured or semi-structured data.
In this article, we will discuss the 10 PySpark functions that are most useful and essential for performing efficient data analysis of structured data.
We are using Google Colab as the IDE for this data analysis.
First we need to install PySpark on Google Colab. Thereafter, we will import the module pyspark.sql and create a SparkSession that will be a Spark SQL API entry point.
#installing pyspark
!pip install pyspark
#importing pyspark
import pyspark

#importing sparksessio
from pyspark.sql import SparkSession

#creating a sparksession object and providing appName
spark=SparkSession.builder.appName("pysparkdf").getOrCreate()
This SparkSession object will interact with Spark SQL functions and methods. Now, let's create a Spark DataFrame by reading a CSV file. We will use a simple data set, namely Nutrition Facts of 80 cereal products available at Kaggle.
#creating a dataframe using spark object by reading csv file
df = spark.read.option("header", "true").csv("/content/cereal.csv")
#show df created top 10 rows
df.show(10)
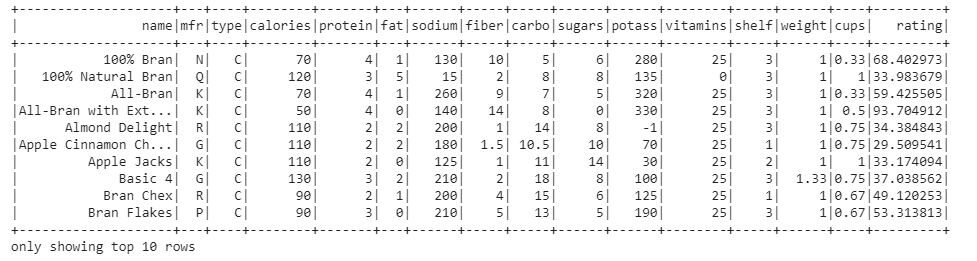
This is the data frame we are using for data analysis. Now, let's print the schema of the DataFrame to know more about the dataset.
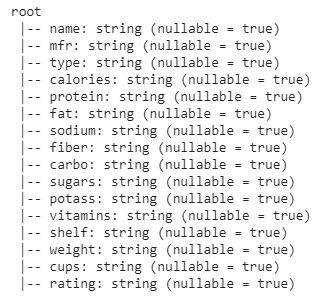
The DataFrame consists of 16 functions or columns. Each column contains values of type string.
Let's start with the functions:
- Please select(): The select function helps us to display a subset of selected columns from the entire data frame, we just need to pass the desired column names. Let's print any three columns of the data frame using selectThe command "SELECT" is fundamental in SQL, used to query and retrieve data from a database. Allows you to specify columns and tables, filtering results using clauses such as "WHERE" and ordering with "ORDER BY". Its versatility makes it an essential tool for data manipulation and analysis, facilitating the obtaining of specific information efficiently.... ().
df.select('name', 'mfr', 'rating').show(10)
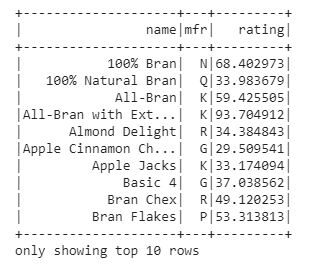
At the exit, we got the subset of the data frame with three columns name, mfr, rating.
- withColumn (): The withColumn function is used to manipulate a column or to create a new column with the existing column. It is a transform function, we can also change the data type of any existing column.
In DataFrame schema, we saw that all columns are of type string. Let's change the data type of the calorie column to a whole number.
df.withColumn("Calories",df['calories'].cast("Integer")).printSchema()
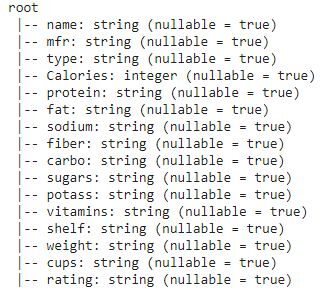
In the scheme, we can see that the Calorie Data Type column is changed to the integer type.
- group by(): The groupBy function is used to collect the data in groups in DataFrame and allows us to perform aggregate functions on the grouped data. This is a very common data analysis operation similar to the groupBy clause in SQL.
Let's find out the count of each cereal present in the data set.
df.groupBy("name", "calories").count().show()
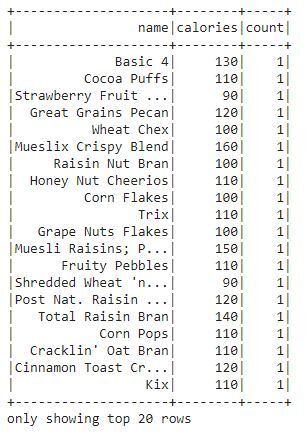
- orderBy (): The orderBy function is used to sort the entire data frame based on the particular column in the data frame. Sort rows in data frame based on column values. By default, is sorted in ascending order.
Let's analyze the data frame based on the protein column of the data set.
df.orderBy("protein").show()
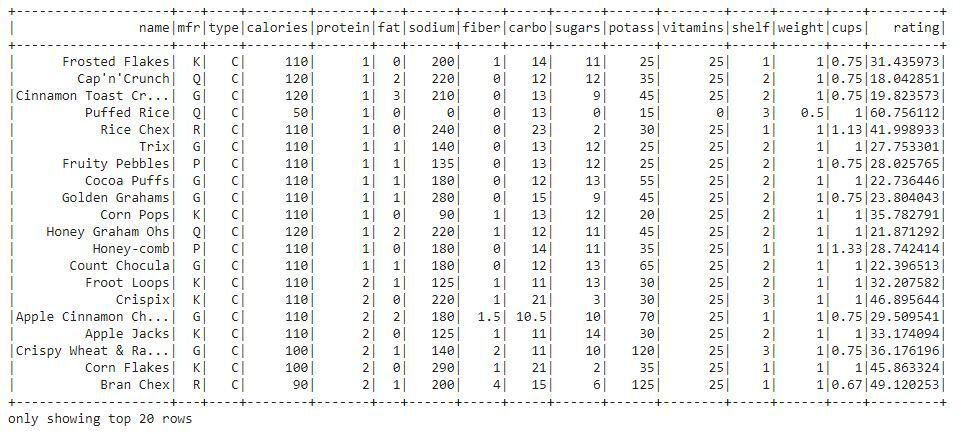
We can see that the entire data frame is ordered based on the protein column.
- break apart(): The split () used to split a data frame string column into multiple columns. This function is applied to the data frame with the help of withColumn () and select ().
Data frame name column contains values in two string words. Let's divide the name column into two columns from the space between two strings.
fropm pyspark.sql.functions import split
df1 = df.withColumn('Name1', split(df['name'], " ").getItem(0))
        .withColumn('Name2', split(df['name'], " ").getItem(1))
df1.select("name", "Name1", "Name2").show()
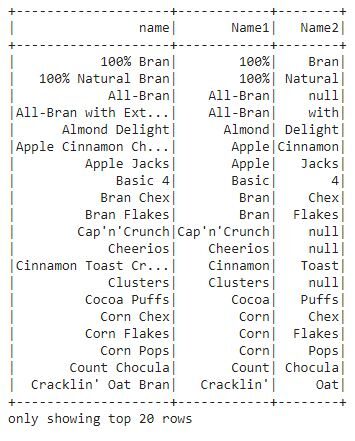
In this output, we can see that the name column is divided into columns.
- illuminated(): The lit function is used to add a new column to the data frame that contains literals or some constant value.
Let's add a column “intake amount” which contains a constant value for each of the cereals along with the name of the respective cereal.
from pyspark.sql.functions import lit
df2 = df.select(col("name"),lit("75 gm").alias("intake quantity"))
df2.show()
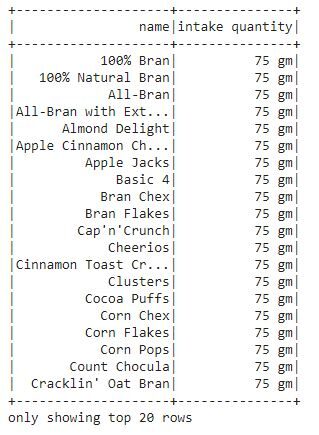
At the exit, We can see that a new column "ingested amount" is created that contains the ingested amount of each cereal.
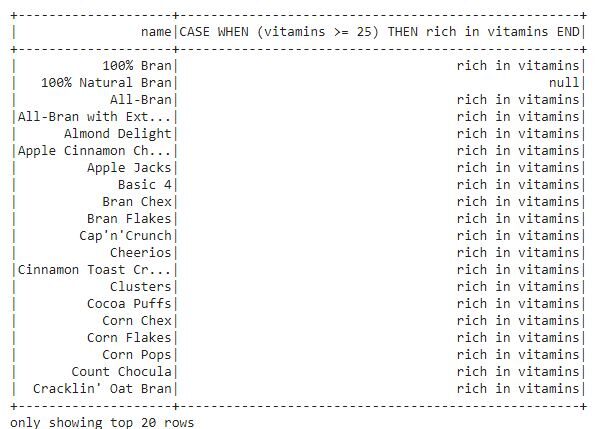
- when(): The when the function is used to display the output based on the particular condition. Evaluate the provided condition and then return the values accordingly. It is a SQL function that PySpark supports to check multiple conditions in a sequence and return the value. This function works similarly as if-then-else and switch statements.
Let's look at cereals that are rich in vitamins.
from pyspark.sql.functions import when
df.select("name", when(df.vitamins >= "25", "rich in vitamins")).show()
- filter(): Filter function is used to filter data in rows based on particular column values. For instance, we can filter cereals that have calories equal to 100.
from pyspark.sql.functions import filter
df.filter(df.calories == "100").show()
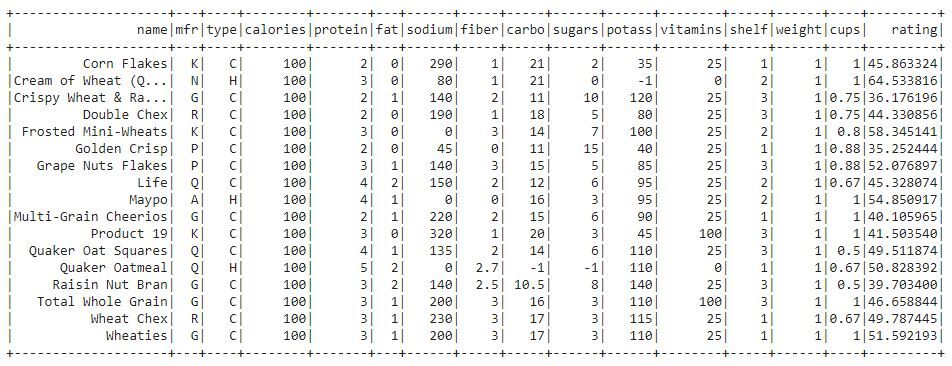
In this output, we can see that the data is filtered according to the cereals that have 100 calories.
- isNull () / isNotNull (): These two functions are used to find out if there are any null values present in the DataFrame. It is the most essential function for data processing. It is the main tool used for data cleaning.
Let's find out if there are any null values present in the data set.
#isNotNull()
from pyspark.sql.functions import *
#filter data by null values
df.filter(df.name.isNotNull()).show()
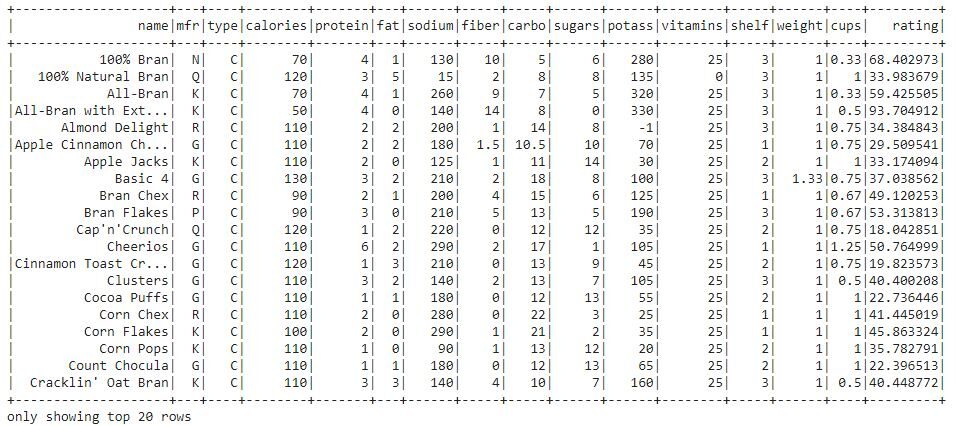
There are no null values present in this dataset. Therefore, the entire data frame is displayed.
It is null():
df.filter(df.name.isNull()).show()

Again, no null values. Therefore, an empty data frame is displayed.
In this blog, we have discussed the 9 more useful functions for efficient data processing. These PySpark functions are the combination of Python and SQL languages.
Thank you for reading. Please let me know if there are any comments or feedback.
The media shown in this article is not the property of DataPeaker and is used at the author's discretion.





