
Introduction
Instead of starting with the definition of statistics, I want to start with the quote from Karl Pearson's definition of Statistics, “Statistics is the
grammar of science ".
Recently, everyone talks about data. After hearing the word “Data” the basic questions that arise in our minds are,
What is data?
How is the data collected?
How can the data be analyzed?
How is the data interpreted?
To answer all these questions, the term “Stats” used. Statistics is the basic and important tool to process data. Coming now to the definition of statistics, it's about the compilation, descriptive, data analysis and conclusion.
There are two types of statistics, Descriptive and inferential statistics.
In Descriptive statistics, from the given observation, the data is summarized. The summary is carried out considering the population sample using the mean or standard deviation.
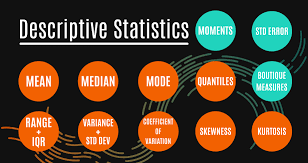
There are four different categories in Descriptive Statistics. Son,
- Frequency measurement
- Dispersion measurement
- Measure of central tendency
- Position measurement.
Based on the number of times a particular piece of data has occurred, the frequency measurement is defined. The dispersion measure can be defined based on the range, the variance, the standard deviation, etc. Average, the medianThe median is a statistical measure that represents the central value of a set of ordered data. To calculate it, the data is organized from lowest to highest and the number in the middle is identified. If there are an even number of observations, the two core values are averaged. This indicator is especially useful in asymmetric distributions, since it is not affected by extreme values...., the mode and skewness of the respective data are included in the measure of central tendency. Finally, based on the percentile and the quartile the position is measured.
Then looking at Inferential statistics, once the data is collected, tabulate and analyze, summary or inference is derived by using inferential statistics. Inferences are drawn based on sample variation and observation error.
Based on the information and the conclusion derived from the sample, inferential statistics help us predict and estimate outcomes for the population.
STATISTICAL DATA ANALYSIS
Statistics are used in a variety of sectors in our daily lives to analyze the correct data. Based on the interpretation, development steps are taken in both the public and private sectors.

Before starting data analysis, there are some things to remember.
Define your question, collect the right data, understand the data, clean data, analyze the data and finally interpret the results of the questions.
What is defining the question? For an organization, improvement steps are taken from previous data analysis. For better steps, there will be some objectives to answer perfectly to give a good interpretation. The question should give the possible solution to the problem. For that frame, a relevant question is more important. Based solely on the questions, the data will be collected. Then, defining the question plays an important role.

For instance, in a company, if employee attrition is high. The solution to reduce the transfer of the employee of the company must be traced so that the basic variables such as the employee's experience, your satisfactory level, your promotion, duration of the working day, etc., are determined so that the problem can be solved to give a possible solution.
How to collect the right data? Data collection has two classifications. One is primary data and one is secondary data. In primary data, data will be collected through questionnaires, by sending emails or reaching out to each person. For example census. While, in secondary data, son los datos que ya están disponibles en la fuente secundaria como agencia o databaseA database is an organized set of information that allows you to store, Manage and retrieve data efficiently. Used in various applications, from enterprise systems to online platforms, Databases can be relational or non-relational. Proper design is critical to optimizing performance and ensuring information integrity, thus facilitating informed decision-making in different contexts.....

Now, before collecting the new data, identify existing data that is available in the database. Other than that, collect the relevant data to satisfy the objective. Later, organize existing data with new data to continue analysis. For instance: Taking the same case of employee termination, the data to collect is experience in the company, working hours, educational qualification, distance from home, travel time, ascent, employee's age, increment or walk, etc., these It is important to collect data to find the reason for employee abandonment. There may be few variables that are already available in the database and new variables can be added as needed.
Why do we need to understand the data? Once the data is collected there may be many variables that are directly or indirectly related to the objective. For that, first we need to study on all variables, ya sea nominal u ordinal. Preparing the data for analysis is done after understanding the data. While we understand, we get to know the types of data, rows and columns, missing from the data, find the independent and dependent variables, etc.
There may be few variables that are not related to the question the organization has and those variables can be used in the future for future analysis.. To find those kinds of variables, it is more important to understand the data. Taking the same example of employee attrition, there may be data related to the family, as family members, years of experience in a previous company, social status, etc., y cada variableIn statistics and mathematics, a "variable" is a symbol that represents a value that can change or vary. There are different types of variables, and qualitative, that describe non-numerical characteristics, and quantitative, representing numerical quantities. Variables are fundamental in experiments and studies, since they allow the analysis of relationships and patterns between different elements, facilitating the understanding of complex phenomena.... debe entenderse de manera que dividir los datos de tal manera por responder a la pregunta.
How is data cleaning done? Data cleansing is the process of modifying data, remove duplicate variables and create dummy variables if necessary. Remove unwanted columns that are not related to the question. If data cleansing is not adequate, can lead to lower model accuracy and can lead to misleading conclusions.
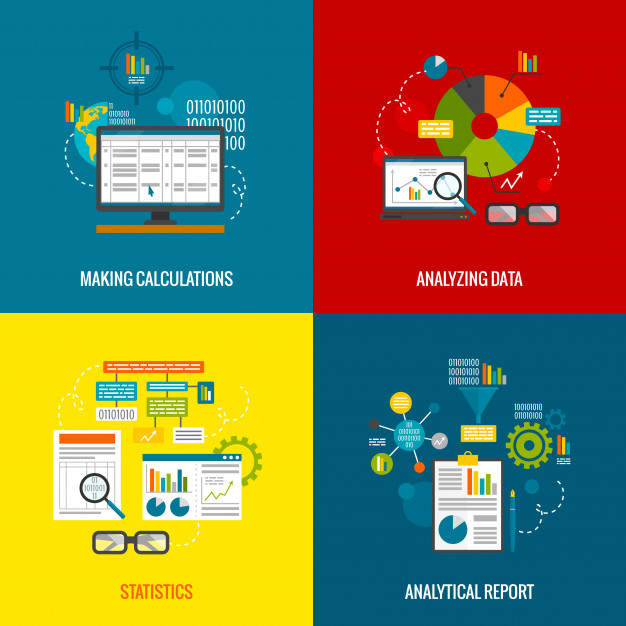
Once the data cleanup is done, the correct data to answer the question is ready. Data manipulation is done in many ways, how to plot the data, create pivot tables for variables, correlation, regression and detect outliers. The process can take place. During the handling stage, it may be necessary to continue with an existing dataset or delete some dataset or it may be necessary to add some more data to answer the question. After all these stages, the required data will be ready for analysis.
How to analyze the data? When it comes to talking about analysis, the main thing is that selection of models. The selection of the model plays an important role in analyzing the data and responding to the objective. Defining the dependent and independent variables is the important stage when analyzing the data.. Nowadays, machine learning techniques are used for data analysis, so that predictions and interpretations can be made easily. But still, some objectives can be answered directly while performing data visualization and basic statistical analysis. The tools used to analyze the data are, Python, Excel, programming R, SPSS, WAS, etc.,
Correlation is used to find the relationship or association between two or more variables. The correlation is between the values -1 a +1. The interpretation is that, if the correlation is +1 then it is strongly positively correlated, -1 then it is strongly negatively correlated and 0 implies that there is no correlation. Correlation works for both quantitative and qualitative data.

Arriving to regression, this analysis is used when we need to find the dependencies of one variable on the other. The regression value is between 0 Y 1. If the regression value is 1, so it's a perfect fit and 0, so not a good fit. The predictive model can be performed using regression analysis. This also uses quantitative and qualitative data. There are two types of regression analysis. Linear regression and multiple linear regression.

In Linear regression, has a dependent variable and an independent variable. For instance, if the price is low, sales will be high. In the case of multiple linear regression model, has one independent variable and several dependent variables. For instance, the price of the house depends on the number of rooms in the house, area of each room, number of parking spaces, facilities, Location, etc.
In the case of Survival analysis, if the data refer to the time of occurrence of an event, then survival analysis can be applied. The event will have the result as 0 O 1. For instance, the patient's survival from a heart attack can be denoted by 0 O 1. 0 denotes the person who did not survive and 1 denotes that he survived. This can be predicted by taking the variables as age, smoker or non-smoker, person living in urban or rural areas, have blood pressure or not. Based on all the factors that are taken into account, the survival status of the person can be estimated. Nowadays, survival analysis can be applied in the case of COVID patients.
Finally getting to the part of Machine learning techniques, like Random Forest, Decision Tree, KNN, etc., can be applied in the case of the prediction and classification technique. On the example of employee attrition, targeting the employee who may leave the company can be determined using the classification technique. Various models can be developed and, based on the accuracy of the models, you can determine which model can predict future employee attrition. If the precision is greater, that particular model can be used to predict future data.
Interpretation the result: After analyzing the data, it's time to interpret the result. When interpreting the result, check if the analysis answered all the questions that were framed, the data collected assisted in the analysis, and from the interpretation there is a positive result for the improvement of the objective. When considering our example of employee attrition, the analysis part should suggest some better steps or improvements to reduce employee attrition from the company.

These are the most important basics to do and observe when conducting statistical data analysis.
Finally, I wish to quote the words of Seth Godin: “Data is not useful until it is converted into information “
Hope everyone has found some basic insights on statistics and data analysis using statistics.
The media shown in this article is not the property of DataPeaker and is used at the author's discretion.





