This article was published as part of the Data Science Blogathon.
What is a statistical model?
“Modeling is an art, as well as a science, and is aimed at finding a good approximate model … as a basis for statistical inference” – Burnham & Anderson
A statistical model is a type of mathematical model which is part of the assumptions performed to describe the data generation process.
Let's focus on the two terms highlighted above:
- Type of mathematical model? The statistical model is not deterministic unlike other mathematical models where the variables have specific values. Variables in statistical models are stochastic, namely, have probability distributions.
- Assumptions? But, How do these assumptions help us understand the properties or characteristics of the true data?? In a nutshell, these assumptions make it easy to calculate the probability of an event.
Quote an example to better understand the role of statistical assumptions in data modeling:
Assumption 1: Assuming we have 2 fair dice and that each face has the same probability of appearing, namely, 1/6. Now, we can calculate the probability that two dice show 5 What 1/6 * 1/6. How can we calculate the probability of each event, constitutes a statistical model.
Assumption 2: The dice are weighted and all we know is that the probability of the face 5 it is 1/8, which facilitates the calculation of the probability that both dice show 5 What 1/8 * 1/8. But we don't know the probability of other faces, so we cannot calculate the probability of each event. Therefore, this assumption does not constitute a statistical model.
Why do we need statistical modeling?
The statistical model plays a fundamental role in making statistical inferences that help make propositions about the unknown properties and characteristics of the population as shown below:
1) Estimate:
It is the central idea behind machine learning, namely, find out the number that can estimate the distribution parameters.
Note that the estimator is a random variable itself, while an estimate is a unique number that gives us an idea of the distribution of the data generation process. For instance, the mean and sigma of the Gaussian distribution
2) Confidence interval:
Gives an error bar around the single estimate number, namely, a range of values to indicate confidence in the estimate obtained on the basis of several samples. For instance, estimate A is calculated from 100 samples and has a wider confidence interval, while estimate B is calculated from 10000 samples and, Thus, has a narrower confidence interval.
3) Hypothesis testing
It is a statement of seeking statistical evidence. Let's better understand the need for statistical modeling with the help of an example below.
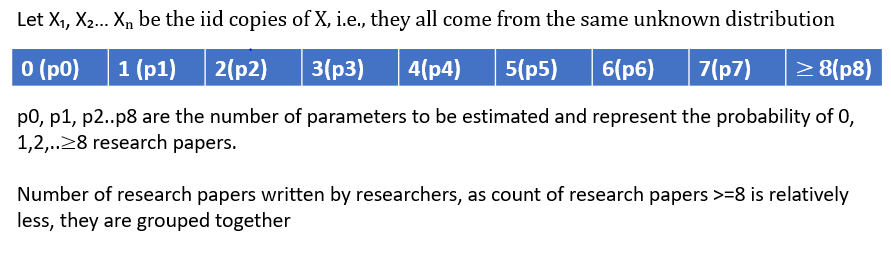
The goal is to understand the underlying distribution to calculate the probability that a randomly selected researcher would have written, Let's say, 3 research articles.
We have a discrete random variable with 8 (9-1) parameters to learn, namely, probability 0,1,2 .. Investigation work. As the number of parameters to estimate increases, so is the need to have so many observations, but this is not the purpose of data modeling.
Then, we can reduce the number of unknowns from 8 parameters to only 1 lambda parameter, simply assuming that the data follow the Poisson distribution.
Our assumption that the data follow the Poisson distribution could be a simplification compared to the actual data generation process, but it is a good approximation.
Types of modeling assumptions:
Now that we understand the importance of statistical modeling, let's understand the types modeling assumptions:
1) Parametric: Assumes a finite set of parameters that capture everything related to the data. If we know the parameter θ that embodies the data generation process very well, then the predictions (x) are independent of the observed data (D)
2) in parametric: Assume that no finite set of parameters can define the data distribution. The complexity of the model is unlimited and grows with the amount of data
3) Semiparamétrico: It is a hybrid model whose assumptions lie between parametric and non-parametric approaches. It consists of the components: structural (parametric) and random variation (in parametric). The Cox proportional hazard model is a popular example of semi-parametric assumptions.
Definition of a statistical model: (S, P)
S: Suppose we have a collection of copies N iid like X1, X2, X3… Xn through a statistical experiment (is the process of generating or collecting data). All these Random variables can be measured in a sample space denoted by S.
PAG: Is he set of probability distributions in S A containing the distribution that is an approximate representation of our actual distribution.
Let's internalize the concept of sample space before understanding how a statistical model could be represented for these distributions.
1) Bernoulli: {0,1}
2) Gaussiano: (-∞, + ∞)
Then, now we have seen some examples of the sample space of some of the families of the distribution, now let's see how a statistical model is defined:
1) Bernoulli: ({0,1}, (Ber (p)) p∈ (0,1))
2) Gaussiano: ((-∞, + ∞), (N (𝜇, 0.3)) 𝜇∈R)
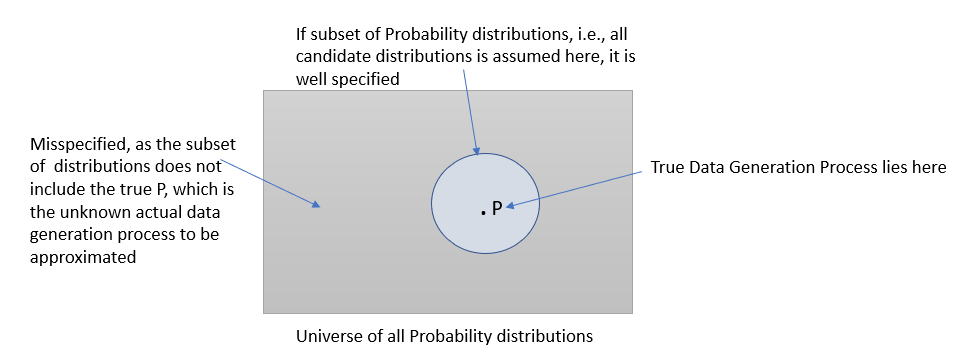
Good, specified and mis-specified models:
What is model specification? According to Wikipedia definition:
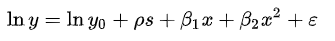
Model specification consists of selecting a functional form suitable for the model. For instance, dice “personal income” (Y) With “years of schooling” (s) Y “experience on the job” (x), we could specify a functional relationship y = f (s, x)} as follows:
Wrong specification model: Has it ever happened to you that the model correctly converges on simulated data, but by the time the actual data arrives, its robustness degrades and no longer converges? Good, this could happen normally if the model you developed does not match the data, what is generally referred to as the Wrong Specification Model. It could be because the distribution class assumed for modeling does not contain the unknown probability distribution p from which the sample is drawn, namely, the real data generation process.
Source: Author
I hope this article has given you an understanding of what a statistical model is, why we need such models, what role assumptions play and how can those assumptions decide the goodness of our model.
*The distribution process / generation of real or real data referred to throughout this article implies that there is a probability distribution that is induced by the process that generates the observed data.
References:
https://mc-stan.org/docs/2_22/stan-users-guide/well-specified-models.html
http://mlss.tuebingen.mpg.de/2015/slides/ghahramani/gp-neural-nets15.pdf
https://courses.edx.org/courses/course-v1:MITx+18.6501x+3T2019/course/


