Introduction
In a typical customer journey 'from thinking to buying', a customer goes through multiple touch points before concentrating on the final product to purchase. This is even more prominent in the case of ecommerce sales.. It is relatively easier to track which are the different points of contact that the customer has found before making the final purchase.

Source: MarTech Today
A measureThe "measure" it is a fundamental concept in various disciplines, which refers to the process of quantifying characteristics or magnitudes of objects, phenomena or situations. In mathematics, Used to determine lengths, Areas and volumes, while in social sciences it can refer to the evaluation of qualitative and quantitative variables. Measurement accuracy is crucial to obtain reliable and valid results in any research or practical application.... que el marketing se mueve cada vez más hacia el lado de las cosas impulsado por el consumidor, Identifying the right channels for target customers has become critical for businesses. This helps companies optimize their marketing investment and target the right customers in the right places..
Most of the time, companies usually invest in the last channel that customers find before making the final purchase. But nevertheless, this may not always be the right approach. There are multiple channels that precede that channel that eventually drive customer conversion.. The underlying concept for studying this behavior is known as “multichannel attribution model”.
In this article, we analyze what channel attribution is and how it relates to the concept of Markov chains. We will also take a case study of an e-commerce company to understand how this concept works., both theoretically and practically (using R).
Table of Contents
- What is channel attribution?
- Markov chains
- Elimination effect
- Case study of an e-commerce company
- Implementation in R
What is channel attribution?
Google Analytics offers a standard set of rules for attribution modeling. According to Google, "An attribution model is the rule, or set of rules, which determines how credit for sales and conversions is allocated to touchpoints on conversion paths. For instance, The Last Interaction model in Analytics assigns the 100% credit to final contact points (namely, the clicks) that immediately precede sales or conversions. Conversely, the First Interaction model assigns the 100% from credit to touchpoints that initiate conversion paths “.
We will see the last interaction model and the first interaction model later in this article.. Before that, let's take a little example and understand channel attribution a little more. Let's say we have a transition diagram as shown below:
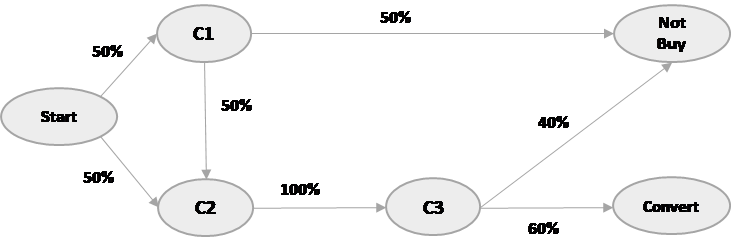
In the above scenario, a customer can start their journey through channel ‘C1’ or channel 'C2'. The probability of starting with C1 or C2 is 50% (O 0.5) each. Let's first calculate the overall conversion probability and then go further to see the effect of each of the channels.
P (conversion) = P (C1 -> C2 -> C3 -> Conversion) + P (C2 -> C3 -> Conversion)
= 0,5 * 0,5 * 1 * 0,6 + 0,5 * 1 * 0,6
= 0,15 + 0,3
= 0,45
Markov chains
Markov chains are a process that maps motion and provides a probability distribution to go from one state to another. A Markov chain is defined by three properties:
- State space – set of all states in which the process could potentially exist
- Transition operator –The probability of passing from one state to another
- Probability distribution of the current state – probability distribution of being in any of the states at the beginning of the process
We know the stages we can go through, the probability of moving from each of the paths and we know the current state. This looks like Markov chains, ¿no?
Elimination effect
This is, in fact, an application of Markov chains. We will come back to this later.; let's follow our example for now. If we were to find out what the contribution of the channel is 1 in our client's journey from the beginning to the end of the conversion, we will use the principle of removal effect. The principle of the elimination effect says that if we want to find the contribution of each channel in the customer journey, we can do it by removing each channel and see how many conversions are happening without that channel being in place.
For instance, suppose we have to calculate the contribution of channel C1. We will remove channel C1 from the model and see how many conversions are happening without C1 in the image, namely, full conversion when all channels are intact. Let's calculate for channel C1:

P (Conversion after removing C1) = P (C2 -> C3 -> Turn into)
= 0,5 * 1 * 0,6
= 0,3
The 30% of customer interactions can be converted without channel C1 being in place; while with C1 intact, you can convert the 45% of interactions. Then, the removal effect of C1 is
0,3 / 0,45 = 0,666.
The removal effect of C2 and C3 is 1 (you can try to calculate it, but think intuitively. If we eliminate C2 or C3, Could we complete any conversion?).
This is a very useful application of Markov chains. In the above case, all the channels – C1, C2, C3 (in different stages) – are called transition states; while the probability of passing from one channel to another is called transition probability.
The customer journey, what is a channel sequence, can be thought of as a chain in a directed Markov graph where each vertex is a state (canal / contact point), and each edge represents the transition probability of going from one state to another. Since the probability of reaching a state depends only on the previous state, can be considered as a memoryless Markov chain.
Case study of an e-commerce company
Let's take a real life case study and see how we can implement the channel attribution model.
An e-commerce company conducted a survey and collected data from its customers. This can be considered as a representative population. In the survey, the company collected data on the various contact points that customers visit before finally purchasing the product on its website.
Total, there is 19 channels where customers can find the product or product advertisement. After the 19 channels, there are three more cases:
- # 20 – the customer has decided which device to buy;
- # 21 – the customer has made the final purchase and;
- # 22 – the customer has not decided yet.
The general categories of channels are as follows:
| Category | Canal |
| Website (1,2,3) | Company website or competitor website |
| Investigation reports (4,5,6,7,8) | Industry Advisory Research Reports |
| Online / Reviews (2) (9,10) | Organic searches, forums |
| Price comparison (11) | Aggregators |
| Friends (12,13) | Red social |
| Expert (14) | Expert online or offline |
| Shops (15,16,17) | Physical stores |
| Misc. (18,19) | Others, as promotional campaigns in various locations. |
Now, we need to help the e-commerce company identify the right strategy to invest in marketing channels. What channels should I focus on? In which channels should the company invest? We will solve this using R in the next section.
Implementation using R
Let's go ahead and try the implementation in R and verify the results. You can download the dataset here and follow as we go.
#Install the libraries
install.packages("ChannelAttribution")
install.packages("ggplot2")
install.packages("reshape")
install.packages("dplyr")
install.packages("plum")
install.packages("reshape2")
install.packages("markovchain")
install.packages("plotly")

#Load the libraries
library("ChannelAttribution")
library("ggplot2")
library("reshape")
library("dplyr")
library("plum")
library("reshape2")
library("markovchain")
library("plotly")

#Read the data into R
> channel = read.csv("Channel_attribution.csv", header = T)
> head(channel)
Production:
| R05A.01 | R05A.02 | R05A.03 | R05A.04 | … .. | R05A.18 | R05A.19 | R05A.20 |
| sixteen | 4 | 3 | 5 | N / A | N / A | N / A | |
| 2 | 1 | 9 | 10 | N / A | N / A | N / A | |
| 9 | 13 | 20 | sixteen | N / A | N / A | N / A | |
| 8 | 15 | 20 | 21 | N / A | N / A | N / A | |
| sixteen | 9 | 13 | 20 | N / A | N / A | N / A | |
| 1 | 11 | 8 | 4 | N / A | N / A | N / A |
We will do a bit of data processing to bring it to a stage where we can use it as input to the model. Later, we will identify which customer journeys have gone into the final conversion (in our case, all tours have reached final conversion status).
We will create a ‘route’ variableIn statistics and mathematics, a "variable" is a symbol that represents a value that can change or vary. There are different types of variables, and qualitative, that describe non-numerical characteristics, and quantitative, representing numerical quantities. Variables are fundamental in experiments and studies, since they allow the analysis of relationships and patterns between different elements, facilitating the understanding of complex phenomena.... en un formato específico que se puede alimentar como entrada al modelo. What's more, we will find out the total occurrences of each route using the 'dplyr' package.
> for(row in 1:nrow(channel))
{
  if(21 %in% channel[row,]){channel$convert[row] = 1}
}
> column = colnames(channel)
> channel$path = do.call(paste, c(channel[column], sep = " > "))
> head(channel$path)
[1] "16 > 4 > 3 > 5 > 10 > 8 > 6 > 8 > 13 > 20 > 21 > NA > NA > NA > NA > NA > NA > NA > NA > NA > NA > 1"

[2] "2 > 1 > 9 > 10 > 1 > 4 > 3 > 21 > NA > NA > NA > NA > NA > NA > NA > NA > NA > NA > NA > NA > NA > 1"

[3] "9 > 13 > 20 > 16 > 15 > 21 > NA > NA > NA > NA > NA > NA > NA > NA > NA > NA > NA > NA > NA > NA > NA > 1"

[4] "8 > 15 > 20 > 21 > NA > NA > NA > NA > NA > NA > NA > NA > NA > NA > NA > NA > NA > NA > NA > NA > NA > 1"

[5] "16 > 9 > 13 > 20 > 21 > NA > NA > NA > NA > NA > NA > NA > NA > NA > NA > NA > NA > NA > NA > NA > NA > 1"

[6] "1 > 11 > 8 > 4 > 9 > 21 > NA > NA > NA > NA > NA > NA > NA > NA > NA > NA > NA > NA > NA > NA > NA > 1"
> for(row in 1:nrow(channel))
{
  channel$path[row] = strsplit(channel$path[row], " > 21")[[1]][1]
}
> channel_fin = channel[,c(23,22)]
> channel_fin = ddply(channel_fin,~path,summarise, conversion= sum(convert))
> head(channel_fin)
Production:
| path | conversion |
| 1> 1> 1> 20 | 1 |
| 1> 1> 12> 12 | 1 |
| 1> 1> 14> 13> 12> 20 | 1 |
| 1> 1> 3> 13> 3> 20 | 1 |
| 1> 1> 3> 17> 17 | 1 |
| > 1> 6> 1> 12> 20> 12 | 1 |
> Data = channel_fin
> head(Data)
Production:
| path | conversion |
| 1> 1> 1> 20 | 1 |
| 1> 1> 12> 12 | 1 |
| 1> 1> 14> 13> 12> 20 | 1 |
| 1> 1> 3> 13> 3> 20 | 1 |
| 1> 1> 3> 17> 17 | 1 |
| 1> 1> 6> 1> 12> 20> 12 | 1 |
Now, we will create a heuristic model and a Markov model, we will combine the two and then check the final results.
> H <- heuristic_models(Data, 'path', 'conversion', var_value ="conversion")
> H
Production:
| Channel Name | first_touch_conversions | … .. | linear_touch_conversions | linear_touch_value |
| 1 | 130 | 73.773661 | 73.773661 | |
| 20 | 0 | 473.998171 | 473.998171 | |
| 12 | 75 | 76.127863 | 76.127863 | |
| 14 | 34 | 56.335744 | 56.335744 | |
| 13 | 320 | 204.039552 | 204.039552 | |
| 3 | 168 | 117.609677 | 117.609677 | |
| 17 | 31 | 76.583847 | 76.583847 | |
| 6 | 50 | 54.707124 | 54.707124 | |
| 8 | 56 | 53.677862 | 53.677862 | |
| 10 | 547 | 211.822393 | 211.822393 | |
| 11 | 66 | 107.109048 | 107.109048 | |
| sixteen | 111 | 156.049086 | 156.049086 | |
| 2 | 199 | 94.111668 | 94.111668 | |
| 4 | 231 | 250.784033 | 250.784033 | |
| 7 | 26 | 33.435991 | 33.435991 | |
| 5 | 62 | 74.900402 | 74.900402 | |
| 9 | 250 | 194.07169 | 194.07169 | |
| 15 | 22 | 65.159225 | 65.159225 | |
| 18 | 4 | 5.026587 | 5.026587 | |
| 19 | 10 | 12.676375 | 12.676375 |
> M <- markov_model(Data, 'path', 'conversion', var_value ="conversion", order = 1)> M
Production:
| Channel Name | total_conversion | total_conversion_value |
| 1 | 82.482961 | 82.482961 |
| 20 | 432.40615 | 432.40615 |
| 12 | 83,942587 | 83,942587 |
| 14 | 63.08676 | 63.08676 |
| 13 | 195.751556 | 195.751556 |
| 3 | 122.973752 | 122.973752 |
| 17 | 83.866724 | 83.866724 |
| 6 | 63.280828 | 63.280828 |
| 8 | 61.016115 | 61.016115 |
| 10 | 209.035208 | 209.035208 |
| 11 | 118.563707 | 118.563707 |
| sixteen | 158.692238 | 158.692238 |
| 2 | 98.067199 | 98.067199 |
| 4 | 223.709091 | 223.709091 |
| 7 | 41.919248 | 41.919248 |
| 5 | 81.865473 | 81.865473 |
| 9 | 179.483376 | 179.483376 |
| 15 | 70.360777 | 70.360777 |
| 18 | 5.950827 | 5.950827 |
| 19 | 15.545424 | 15.545424 |
Before moving on, Let's first understand what some of the terms we have seen above mean.
First touch conversion: The conversion that occurs through the channel when that channel is the first point of contact for a customer. The 100% credit to first point of contact.
Last touch conversion: The conversion that occurs through the channel when that channel is the last point of contact for a customer. The 100% credit to last point of contact.
Linear touch conversion: All the channels / touchpoints receive the same credit on conversion.
Going back to R code, let's merge the two models and represent the result in a visually appealing way that is easier to understand.
# Merges the two data frames on the "channel_name" column.
R <- merge(H, M, by='channel_name')

# Select only relevant columns
R1 <- R[, (colnames(R) %in %c('channel_name', 'first_touch_conversions', 'last_touch_conversions', 'linear_touch_conversions', 'total_conversion'))]

# Transforms the dataset into a data frame that ggplot2 can use to plot the outcomes
R1 <- melt(R1, id='channel_name')
# Plot the total conversions
ggplot(R1, aes(channel_name, value, fill = variable)) +
  geom_bar(stat="identity", position='dodge') +
  ggtitle('TOTAL CONVERSIONS') +
  theme(axis.title.x = element_text(vjust = -2)) +
  theme(axis.title.y = element_text(vjust = +2)) +
  theme(title = element_text(size = 16)) +
  theme(plot.title=element_text(size = 20)) +
  ylab("")
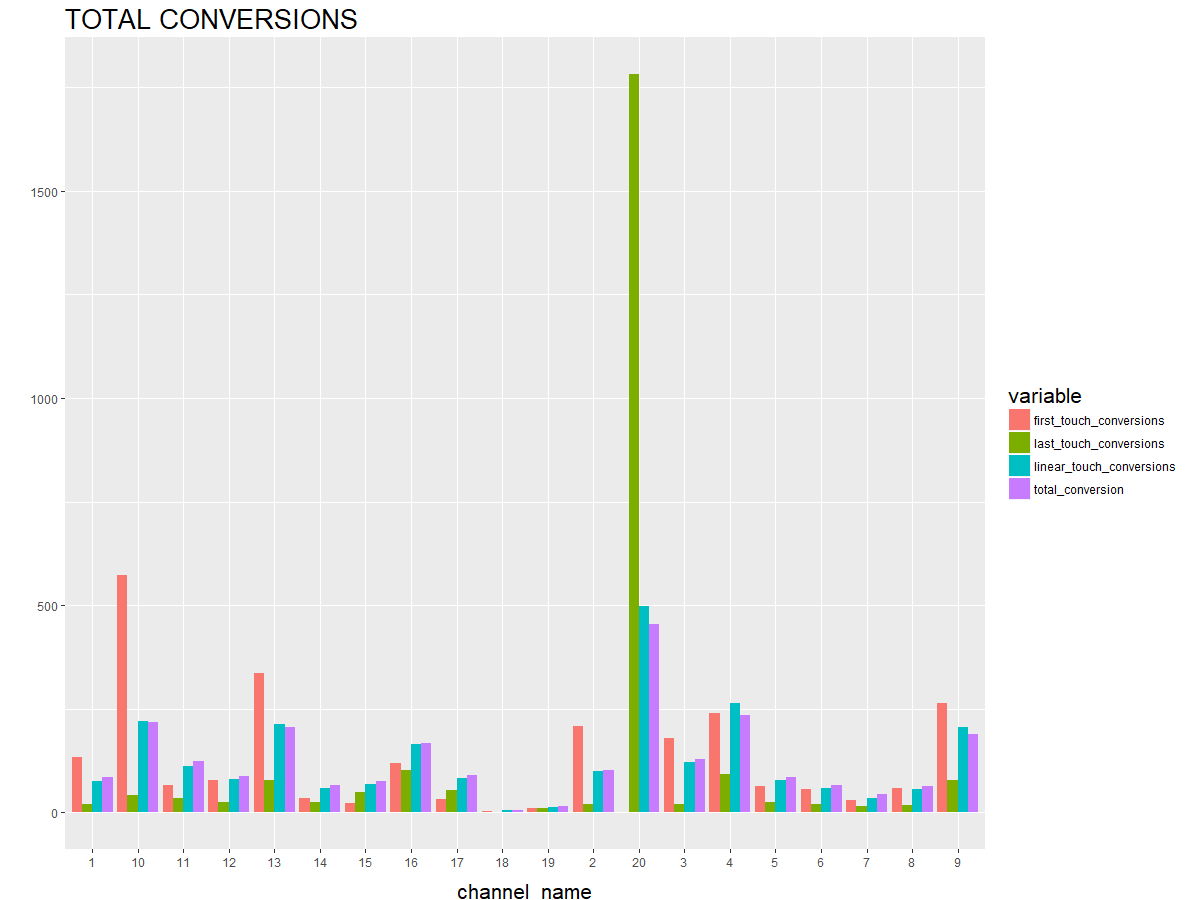
The stage is clearly visible in the graphic above. From the perspective of the first touch conversion, the channel 10, the channel 13, the channel 2, the channel 4 and the channel 9 they are quite important; while from the perspective of the last touch, the channel 20 is the most important (in our case, It should be because the customer has decided which product to buy). In terms of linear touch conversion, the channel 20, the channel 4 and the channel 9 are proving important. From the perspective of total conversions, the channels 10, 13, 20, 4 Y 9 they are quite important.
Final notes
In the graph above we have been able to find out which are the important channels that we should focus on and which can be discarded or ignored. This case gives us a very good idea of the application of Markov chain models in the customer analysis space. Ecommerce companies can now confidently build their marketing strategy and distribute their marketing budget using data-driven information..
Author bio:
This article was contributed by Perceptual analytics. Chaitanya Sagar, Prudhvi Potuganti and Saneesh Veetil developed this article.
Perceptive Analytics provides data analytics, data visualization, business intelligence and reporting services for the e-commerce industries, Retail sale, medical and pharmaceutical care. Our client list includes Fortune listed companies 500 and NYSE in EE. UU. And India.


