
This article refers to one of the supervised ML classification algorithms:KNN algorithm (K nearest neighbors). It is one of the simplest and most widely used classification algorithms in which a new data point is classified based on similarity in the specific group of neighboring data points. This gives a competitive result.
Labor
For a given data point in the set, the algorithms find the distances between this and all the others K numbers of data points in the data set near the starting point and votes for the category that has the highest frequency. Generally, Euclidean distance is taking as a measure of distance. Therefore, the final resulting model is just the labeled data placed in a space. This algorithm is popularly known by various applications such as genetics, forecast, etc. The algorithm is better when more features are present and shows SVM in this case.
KNN reducing overfitting is a given. Secondly, it is necessary to choose the best value for K. Then, How do we choose K? We generally use the square root of the number of samples in the data set as the value for K. An optimal value must be found as a lower value can lead to overfitting and a higher value can require great computational complication in the distance.. Therefore, using an error plot can help. Another method is the elbow method. May prefer to take root, otherwise you can also follow the elbow method.
Let's dive into the different K-NN steps to classify a new data point
Paso 1: Select the value of K neighbors (let's say k = 5)
Paso 2: Find data point K (5) closest for our new data point based on Euclidean distance (that we will discuss later)
Paso 3: Between these K data points, count the data points in each category.
Paso 4: Assign the new data point to the category that has the most neighbors of the new data point
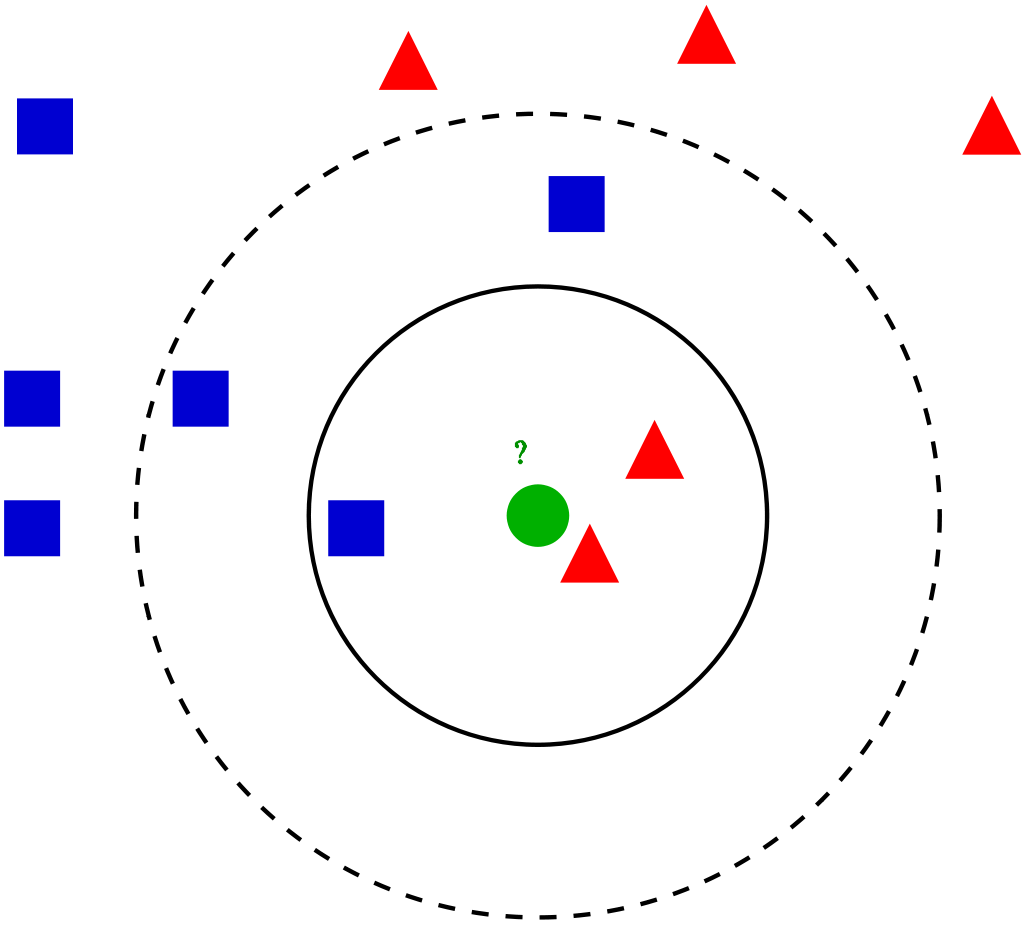
Example
Let's go through an example problem to get a clear intuition about the K-Nearest Neighbor classification. We are using the social media ad dataset (Descargar). The dataset contains the details of users on a social media site to find out if a user buys a product by clicking on the ad on the site based on their salary, age and gender.
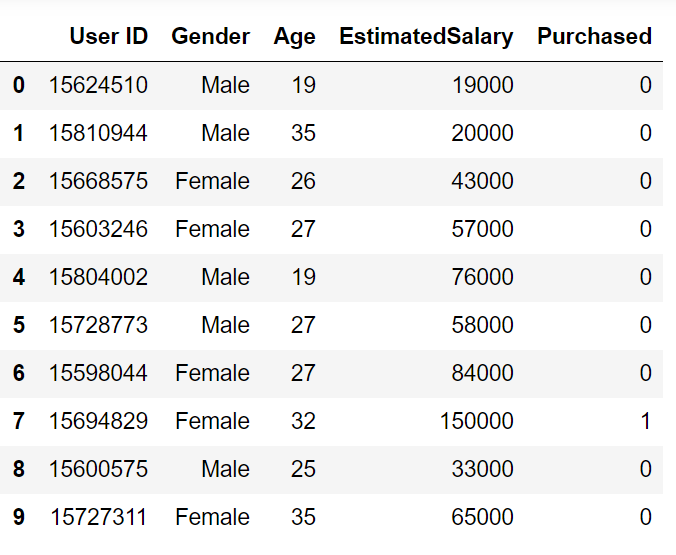
Let's start programming by importing essential libraries
import numpy as np
import matplotlib.pyplot as plt
import pandas as pd
import sklearn
Import the dataset and divide it into independent and dependent variables
dataset = pd.read_csv('Social_Network_Ads.csv')
X = dataset.iloc[:, [1, 2, 3]].values
y = dataset.iloc[:, -1].values
Since our dataset contains character variables, we have to encode it using LabelEncoder
from sklearn.preprocessing import LabelEncoder
le = LabelEncoder()
X[:,0] = le.fit_transform(X[:,0])
We are running a split train test on the dataset. We provide a trial size of 0,20, which means that our training sample contains 320 training sets and test sample contains 80 test sets
from sklearn.model_selection import train_test_split
X_train, X_test, y_train, y_test = train_test_split(X, Y, test_size = 0.20, random_state = 0)
Then, we are going to perform a scaling of characteristics to the training set and test of independent variables to reduce the size to smaller values.
from sklearn.preprocessing import StandardScaler
sc = StandardScaler()
X_train = sc.fit_transform(X_train)
X_test = sc.transform(X_test)
Now we have to create and train the K Nearest Neighbor model with the training set
from sklearn.neighbors import KNeighborsClassifier
classifier = KNeighborsClassifier(n_neighbors = 5, metric="minkowski", p = 2)
classifier.fit(X_train, y_train)
We are using 3 parameters in model creation. n_neighbors is set to 5, which means they are required 5 neighborhood points to classify a given point. The distance metric we are using is Minkowski, the equation for it is given below
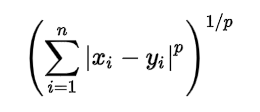
According to the equation, we also have to select the p-value.
p = 1, Distance from Manhattan
p = 2, Euclidean distance
p = infinity, Cheybchev distance
In our problem, we choose p as 2 (also u can choose the metric like “Euclidean”)
Our model is created, now we have to predict the output for the test set
y_pred = classifier.predict(X_test)
Comparison of true and predicted value:
y_test
array([0, 0, 0, 0, 0, 0, 0, 1, 0, 0, 0, 0, 0, 0, 0, 0, 0, 0, 1, 0, 0, 1,
       0, 1, 0, 1, 0, 0, 0, 0, 0, 1, 1, 0, 0, 0, 0, 0, 0, 1, 0, 0, 0, 0,
       1, 0, 0, 1, 0, 1, 1, 0, 0, 0, 1, 1, 0, 0, 1, 0, 0, 1, 0, 1, 0, 1,
       0, 0, 0, 0, 1, 0, 0, 1, 0, 0, 0, 0, 1, 1, 1, 0, 0, 0, 1, 1, 0, 1,
       1, 0, 0, 1, 0, 0, 0, 1, 0, 1, 1, 1], dtype=int64)
y_pred
array([0, 0, 0, 0, 0, 0, 0, 1, 0, 1, 0, 0, 0, 0, 0, 1, 0, 0, 1, 0, 0, 1,
       0, 1, 0, 1, 0, 0, 0, 0, 0, 0, 1, 0, 0, 0, 0, 0, 0, 1, 0, 0, 0, 0,
       1, 0, 0, 1, 0, 1, 1, 0, 0, 1, 1, 1, 0, 0, 1, 0, 0, 1, 0, 1, 0, 1,
       0, 0, 0, 0, 1, 0, 0, 1, 0, 0, 0, 0, 1, 1, 1, 1, 0, 0, 1, 0, 0, 1,
       1, 0, 0, 1, 0, 0, 0, 0, 0, 1, 1, 1], dtype=int64)
We can evaluate our model using the confusion matrix and the precision score comparing the predicted and actual test values
from sklearn.metrics import confusion_matrix,accuracy_score
cm = confusion_matrix(y_test, y_pred)
ac = accuracy_score(y_test,y_pred)
confusion matrix –
[[64  4]
 [ 3 29]]
precision is 0,95
# Importing the libraries
import numpy as np
import matplotlib.pyplot as plt
import pandas as pd

# Importing the dataset
dataset = pd.read_csv('Social_Network_Ads.csv')
X = dataset.iloc[:, [2, 3]].values
y = dataset.iloc[:, -1].values

# Splitting the dataset into the Training set and Test set
from sklearn.model_selection import train_test_split
X_train, X_test, y_train, y_test = train_test_split(X, Y, test_size = 0.20, random_state = 0)

# Feature Scaling
from sklearn.preprocessing import StandardScaler
sc = StandardScaler()
X_train = sc.fit_transform(X_train)
X_test = sc.transform(X_test)

# Training the K-NN model on the Training set
from sklearn.neighbors import KNeighborsClassifier
classifier = KNeighborsClassifier(n_neighbors = 5, metric="minkowski", p = 2)
classifier.fit(X_train, y_train)

# Predicting the Test set results
y_pred = classifier.predict(X_test)

# Making the Confusion Matrix
from sklearn.metrics import confusion_matrix, accuracy_score
cm = confusion_matrix(y_test, y_pred)
ac = accuracy_score(y_test, y_pred)
The media shown in this article is not the property of DataPeaker and is used at the author's discretion.





