Overview
- What is K stands for Clustering?
- Implementation of K stands for Clustering
- WCSS and elbow method to find the number of clusters
- Python Implementation of K Means Clustering
K means is one of the most popular unsupervised machine learning algorithms used to solve classification problems. K Means segregates the unlabeled data into multiple groups, called clusters, based on having similar characteristics, common patterns.
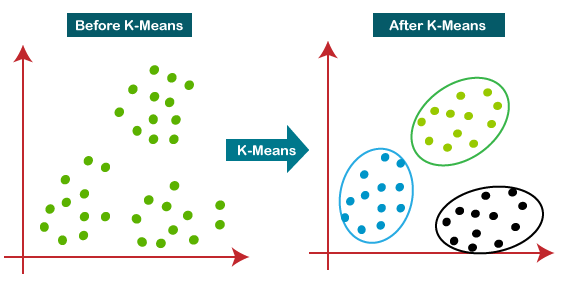
Table of Contents
- What is clustering?
- What does the K algorithm mean?
- Schematic Implementation of KMeans Clustering
- Choose the correct number of clusters
- Python implementation
1. What is clustering?
Suppose we have a number N of unlabeled multivariate data sets of various animals such as dogs, gatos, birds, etc. The technique for segregating data sets into multiple groups, based on having similar characteristics and characteristics, it is called clustering..
The groups that are formed are known as Clusters. Clustering technique is being used in several fields, such as image recognition, spam filtering
Clustering is used in unsupervised learning algorithm in machine learning as multivariate data can be segregated into multiple groups, without any supervisor, based on a common pattern hidden within data sets.
2. What does the K algorithm mean?
The Kmeans algorithm is an iterative algorithm that divides a group of n data sets into k subgroups / clusters based on similarity and their mean distance from the centroid of that subgroup / formed in particular..
K, here is the predefined number of clusters that the algorithm will form. If K = 3, means that the number of clusters that will be formed from the data set is 3
Steps of the mean K algorithm
The operation of the K-Means algorithm is explained in the following steps:
Paso 1: Select the value of K to decide the number of clusters to form.
Paso 2: Select K random points that will act as centroid.
Paso 3: Map each data point, based on its distance from randomly selected points (centroid), to the nearest centroid / close that will form the predefined groups.
Paso 4: place a new centroid of each group.
Paso 5: Repeat step 3, which reassigns each data point to the new closest centroid of each group.
Paso 6: If any reassignment occurs, go to step 4; on the contrary, go to step 7.
Paso 7: END UP
3. Schematic implementation of K means clustering
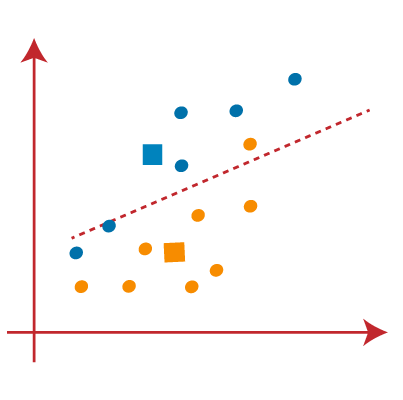
PASO 1:Let's choose the number k of clusters, namely, K = 2, to segregate the dataset and place it in different respective clusters. We will choose some 2 random points that will act as centroids to form the group.
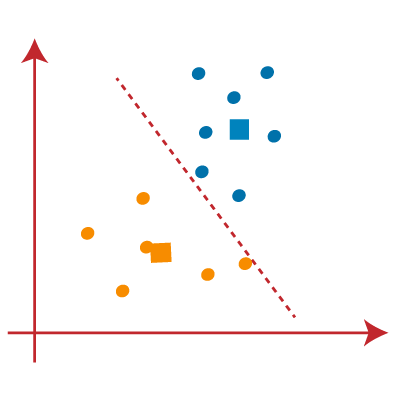
PASO 2: Now we will assign each data point to a scatter plot based on its distance from the nearest K point or centroid.. It will be done by drawing a median between both centroids. Consider the following image:
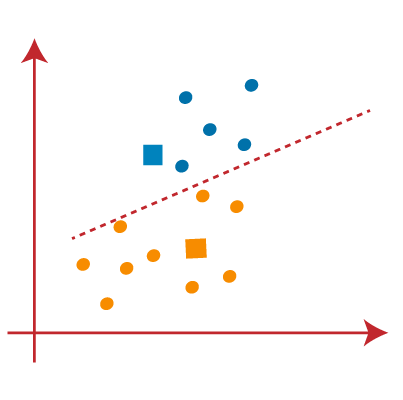
PASO 3: the points on the left side of the line are near the blue centroid and the points on the right of the line are near the yellow centroid. The one on the left forms a group with a blue centroid and the one on the right with a yellow centroid..
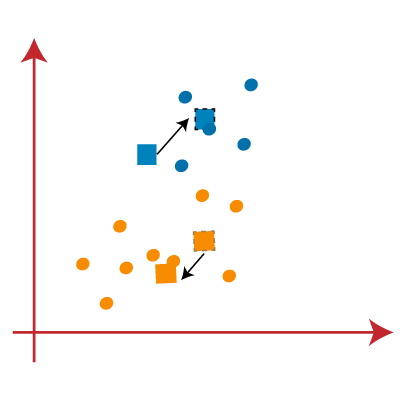
 PASO 4:repeat the process choosing a new centroid. To choose the new centroids, we will find the new center of gravity of these centroids, shown below:
PASO 5: Then, we will reassign each data point to the new centroid. We will repeat the same previous process (using a median line). The yellow data point on the blue side of the median line will be included in the blue group
PASO 6: As the reallocation has been made, we will repeat the previous step of finding new centroids.
PASO 7: We will repeat the previous process of finding the center of gravity of the centroids, as it's shown in the following.
PASO 8: After finding the new centroids, we will draw the median line again and reassign the data points, as in the previous steps.
PASO 9: Finally, we will segregate points based on the median line, so that two groups are formed and no different points are included in a single group.
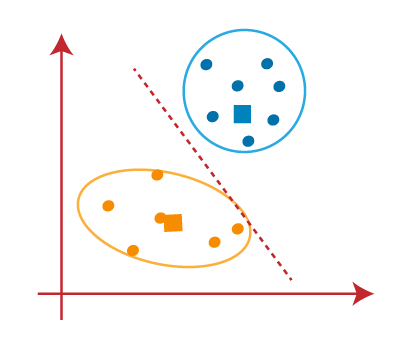
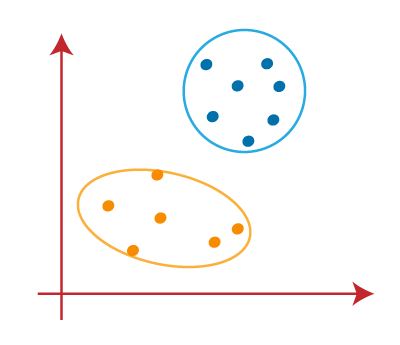
The final group that is being formed is the following
4. Choose the correct number of clusters
The number of clusters we choose for the algorithm must not be random. Each and every cluster is formed by calculating and comparing the mean distances of each data point within a cluster from its centroid.
We can choose the correct number of clusters with the help of the sum of squares method within the cluster (WCSS).
WCSS Represents the sum of the squares of the distances of the data points in each and every group from its centroid.
The main idea is to minimize the distance between the data points and the centroid of the clusters. The process is iterated until reaching a minimum value for the sum of distances.
To find the optimal value of clusters, elbow method follow below steps:
1 Run clustering of K-means on a given data set for different values of K (that go from 1 al 10).
2 For each value of K, calculates the WCSS value.
3 Draw a graph / curve between WCSS values and respective number of clusters K.
4 The acute point of curvature or a point (that looks like an elbow joint) of the frame like an arm, will be considered as the best / optimal K value
5. Python implementation
Import relevant libraries
import numpy as np
import pandas as pd
import statsmodels.api as sm
import matplotlib.pyplot as plt
import seaborn as sns
sns.set()
from sklearn.cluster import KMeans
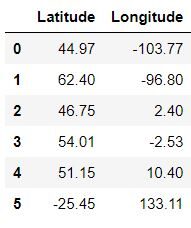
Loading the data
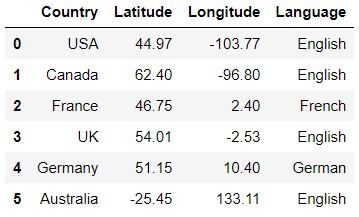
data = pd.read_csv('Countryclusters.csv')
data
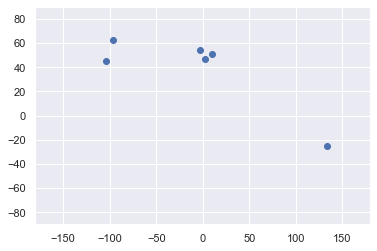
Graph the data
plt.scatter(data['Longitude'],data['Latitude'])
plt.xlim(-180,180)
plt.ylim(-90,90)
plt.show()
Select function
 x = data.iloc[:,1:3] # 1t for rows and second for columns
x
Grouping
kmeans = KMeans(3)
means.fit(x)
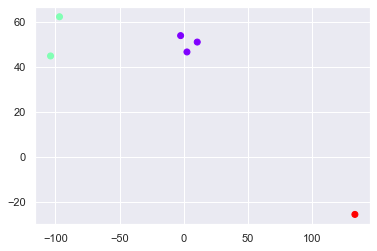
Clustering results
identified_clusters = kmeans.fit_predict(x)
identified_clusters
array([1, 1, 0, 0, 0, 2])
data_with_clusters = data.copy()
data_with_clusters['Clusters'] = identified_clusters
plt.scatter(data_with_clusters['Longitude'],data_with_clusters['Latitude'],c=data_with_clusters['Clusters'],cmap='rainbow')
Try a different method (to find in. Of groups to select)
WCSS and elbow method
wcss=[]
for i in range(1,7):
kmeans = KMeans(i)
kmeans.fit(x)
wcss_iter = kmeans.inertia_
wcss.append(wcss_iter)

number_clusters = range(1,7)
plt.plot(number_clusters,wcss)
plt.title('The Elbow title')
plt.xlabel('Number of clusters')
plt.ylabel('WCSS')
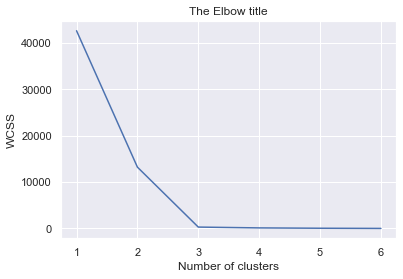
we can choose 3 of course. of conglomerates, this method shows what is the good number of clusters.
With this I end this blog.
Hi everyone, Namaste
My name is Pranshu Sharma and I am a data science enthusiast
Thank you very much for taking your valuable time to read this blog.. Feel free to point out any mistakes (after all, i am an apprentice) and provide the corresponding comments or leave a comment.
Dhanyvaad !!
Feedback:
Email: [email protected]
The media shown in this article is not the property of DataPeaker and is used at the author's discretion.


