Overview
- You can perform predictive models in Excel in just a few steps
- Here is a step by step tutorial on how to build a linear regression model in Excel and how to interpret the results.
Introduction
Excel for predictive modeling? Seriously?
As usual, that's the first reaction i get when i bring up the topic. This is followed by a look of disbelief as I demonstrate how we can take advantage of the flexible nature of Excel to build predictive models for our data science and analytics projects..
Let me ask you a question: if the stores around you started collecting customer data, Could you adopt a data-driven strategy to sell your products?? Can you forecast your sales or estimate the number of products that could be sold?

Now you must be wondering how the heck they will build a complex statistical model that can predict these things. And learning analytics or hiring an analyst might be beyond your reach.. This is the good news: there's no need. Microsoft Excel offers us the ability to create predictive models without having to write complex code that flies over most people's heads.
We can easily build a simple model like linear regression in MS Excel which can help us to perform analysis in few simple steps. And we don't need to be a master of Excel or Statistics to do predictive modeling!!
In this article, i am going to explain how to build a linear regression model in excel and how to analyze the result so that you can become a superstar analyst.
This is the seventh article in my Excel for Analysts series. I highly recommend reading the previous articles to become a more efficient analyst.:
I encourage you to check out the resources below if you are a beginner to Excel and Business Analytics:
Table of Contents
- What is linear regression?
- Get the all-important Add Analytics ToolPak in Excel
- Implementation of linear regression in Excel
- Interpretation of the results of our predictive model
- How can we improve the model?
- Making predictions in Excel!
What is linear regression?
Linear regression is the first machine learning technique most of us learn. It is also the technique of supervised learningSupervised learning is a machine learning approach where a model is trained using a set of labeled data. Each input in the dataset is associated with a known output, allowing the model to learn to predict outcomes for new inputs. This method is widely used in applications such as image classification, speech recognition and trend prediction, highlighting its importance in... most used in the industry.
But, What is linear regression?
It is a linear approach to statistically model the relationship between the variableIn statistics and mathematics, a "variable" is a symbol that represents a value that can change or vary. There are different types of variables, and qualitative, that describe non-numerical characteristics, and quantitative, representing numerical quantities. Variables are fundamental in experiments and studies, since they allow the analysis of relationships and patterns between different elements, facilitating the understanding of complex phenomena.... dependent (the variable you want to predict) and the independent variables (the factors used to predict). Linear regression gives us an equation like this:

Here, we have Y as our dependent variable, the X's are the independent variables and all the C's are the coefficients. The coefficients are basically the weights assigned to the characteristics, depending on its importance.
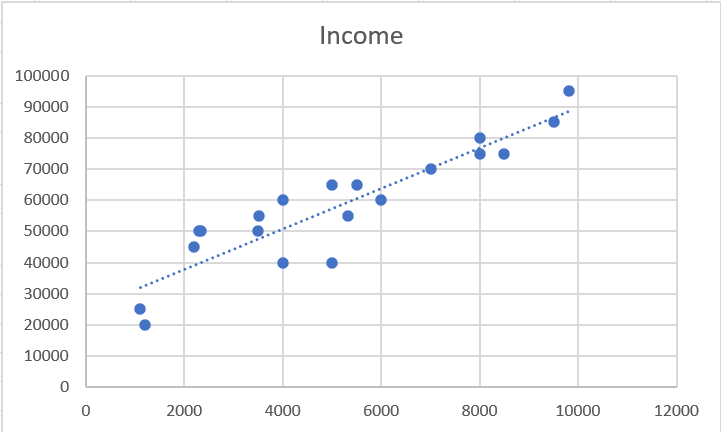
The most common method to perform regression is the OLS (ordinary least squares). Your goal is to reduce the sum of squares to produce the line of best fit like this:
For more information on linear regression, here are some resources:
Get the Excel Add-in for the All-Important Analysis ToolPack
To perform a regression analysis in Excel, first we need to enable Excel Analysis Tools Plugin. Analysis ToolPak in Excel is a companion program that provides data analysis tools for statistical and engineering analysis.
To add it to your workbook, follow these steps.
Paso 1 – Excel Options
Go to Records -> Choices:
Paso 2: ubicar Analytics ToolPak
Go to Accessories in the panelA panel is a group of experts that meets to discuss and analyze a specific topic. These forums are common at conferences, seminars and public debates, where participants share their knowledge and perspectives. Panels can address a variety of areas, from science to politics, and its objective is to encourage the exchange of ideas and critical reflection among the attendees.... left-> Manage Excel add-ins -> Ir:
Paso 3: agregue Analytics ToolPak
Select the “Analysis Toolkit“And press OK:
You have successfully added the Analysis Toolkit in Excel!! You can check it by going to Data bar on tape.
Let's start building our predictive model in Excel!!
Implementation of linear regression in Excel
Many things were theoretical until now. Now, let's dive into Excel and run linear regression analysis!
Here is the statement of the problem that we will work with:
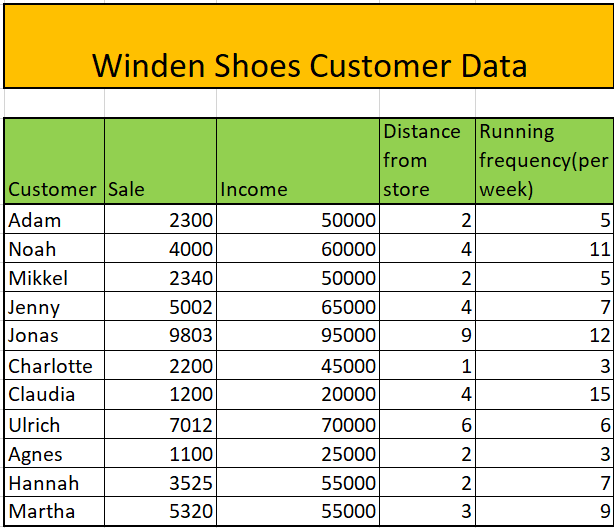
There is a shoe sales company in the town of Winden. The company wants to predict sales through each customer considering the following factors: customer revenue, distance from house to store, client operating frequency per week.
Paso 1: select Regression
Go to Data -> Data analysis:
Go to Data Analysis in the Data Toolkit, select Regression and press OK:
Paso 2: select Options
In this step, we will select some of the necessary options for our analysis, such as:
- Input range and: the range of the independent factor
- Input range x: the range of dependent factors
- Output range: the range of cells where you want to display the results.
The other options are discretionary and you can select them for your specific purpose.
press OK And finally we have performed a regression analysis in Excel in just two steps!! Wasn't it so easy? Now we will see the result of the regression analysis in Excel.
Analyzing the results of our predictive model in Excel
Implementing the linear regression model was the easy part. Now comes the complicated aspect of our analysis: interpret the results of the predictive model in Excel.
In summary, have 3 output types and we'll cover them one by one:
- Regression statistics table
- ANOVA table
- Regression coefficients table
- Residual table
Regression statistics table
The regression statistics table tells us how well the line of best fit defines the linear relationship between the independent and dependent variables.. Two of the most important measurements are the R squared and adjusted R squared values..
the R-square statistics is the indicator of goodness of fit which tells us how much variance is explained by the line of best fit. The value of R squared varies from 0 a 1. In our case, we have the value of R squared of 0,953, which means that our line is able to explain the 95% of the variance, a good sign.
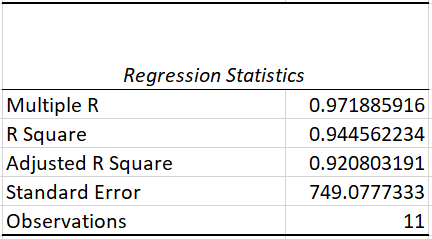
But there is a problem: a measureThe "measure" it is a fundamental concept in various disciplines, which refers to the process of quantifying characteristics or magnitudes of objects, phenomena or situations. In mathematics, Used to determine lengths, Areas and volumes, while in social sciences it can refer to the evaluation of qualitative and quantitative variables. Measurement accuracy is crucial to obtain reliable and valid results in any research or practical application.... that we keep adding more variables, our R squared value will continue to increase even if the variable has no effect. R squared fitted solves this problem and is a much more reliable metric.
ANOVA table
ANOVA means Analysis of variance. This table breaks down the sum of squares into its components to give details of the variability within the model..
Include a very important metric, Meaning F (o la p value), which tells us if your model is statistically significant or not. In a nutshell, means our results are probably not due to randomness, but to an underlying cause. The most commonly used threshold for the p-value is 0,05. If we get a value less than this, we are ready to start. On the contrary, we would need to choose another set of independent variables.
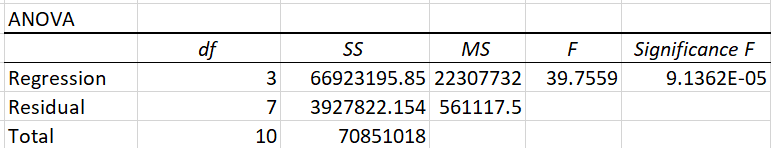
In our case, we have a value well below the threshold of 0,05. ¡Genial, we can move on now!
Regression coefficients table
The coefficient table breaks down the components of the regression line in the form of coefficients. We can understand a lot of these.
For the shoe company Winden, It seems that for every unit of increase in entry, the sale increases by 0.08 units, and an increase in one unit of distance from the store increases in 508 units!
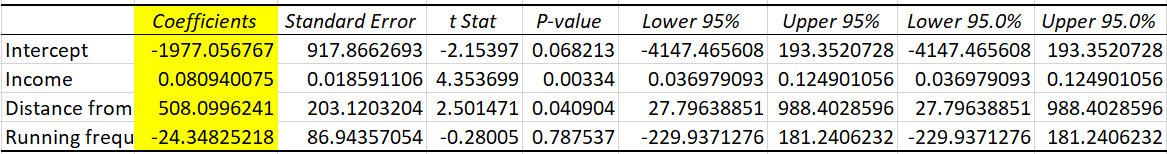
It seems that an increase in operating frequency decreases sales in 24 units, but can we really believe in this feature? If you look at the picture above, you will notice that its p-value is greater than 0.5, which means that it is not statistically significant. We will see how we can handle this situation in the next section..
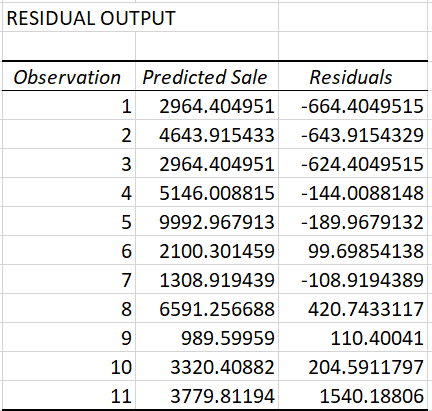
Residual table
The residual table reflects how much the predicted value varies from the actual value. It consists of the values predicted by our model:
How can we improve our model?
As we saw previously, the p-value of the variable operating frequency is more than 0,05, so let's check our results by removing this variable from our analysis.
We will follow all the steps mentioned above but will not include the execution frequency column:
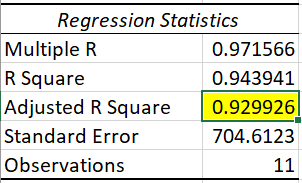
We observe that the adjusted R-squared value improved slightly here from 0,920 a 0,929!
Making predictions in Excel!
We have the regression analysis ready, then, What can we do now? We'll see.
A former customer of his named Aleksander walks in and we want to predict his sales. We can simply enter the number of data into the linear regression model and we are good to go!!
Aleksander has an income of 40k and lives at 2 km from the store. What are the estimated sales?
The equation becomes:
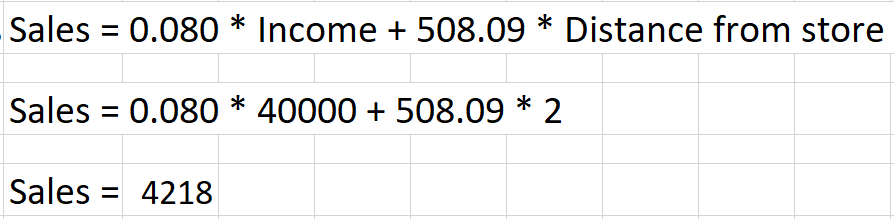
Here, our model has estimated that Mr.. Aleksander would pay 4218 units to buy your new pair of shoes. That's the power of linear regression simply done in Microsoft Excel.
Final notes
In this article, we learned how to build a linear regression model in Excel and how to interpret the results. I hope this guide helps you improve as a data analyst or scientist.
Analytics ToolPak consists of many other analysis options in Excel. You can try many other statistical analysis in your daily life!!