
This article was published as part of the Data Science Blogathon
Table of Contents
Let's take a quick look at this blog.
→ ¿Qué es una Time SeriesA time series is a set of data collected or measured at successive times, usually at regular time intervals. This type of analysis allows you to identify patterns, Trends and cycles in data over time. Its application is wide, covering areas such as economics, Meteorology and public health, facilitating prediction and decision-making based on historical information....?
→ Real life time series scenarios
→ Time series analysis
→ Forecast
→ Forecast types
1) Quantitative forecast
2) Qualitative forecast
→ Regression versus time series
→ Components of time series
→ Analysis of kaggle time series data
→ Plot the time series graph
What is a time series?
The time series is a sequence or series of data points in which the time component is involved throughout the occurrence.
Time series data example
Health Industry – Blood pressure monitoring, heart rate monitoring.
Environment – Global temperature and air pollution levels.
Society – Birth rates over a period of time, population, etc.
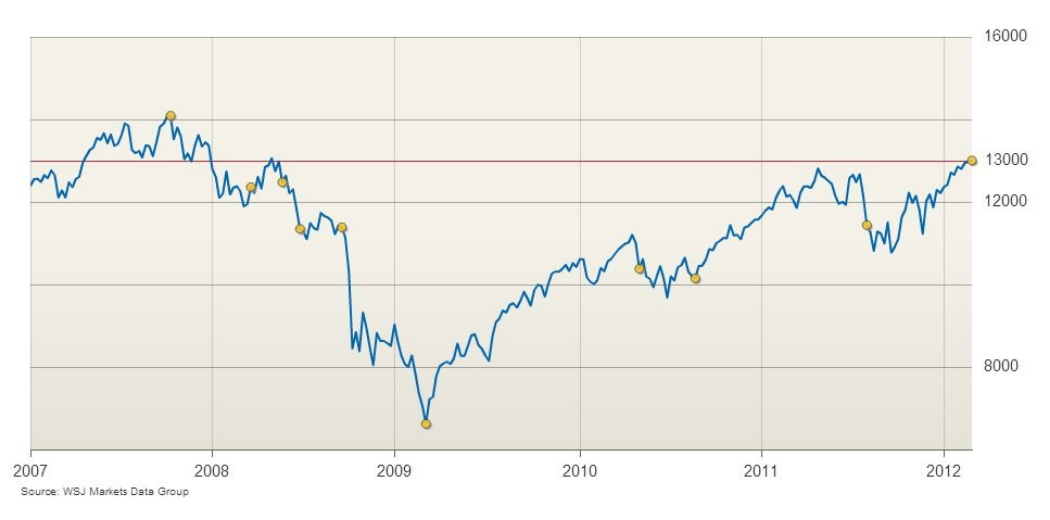
https://www.google.com/url?
What is time series analysis?
Analyzing this time series data with certain tools and techniques is called time series analysis..
Daily restaurant visitors are predicted by this time data series. So that the restaurant management can name and accommodate the staff according to the number of visitors.
Forecast
Forecasting is the process of making predictions from historical data so that you can predict the future from past and present data.
Forecast types:
1) Quantitative forecast
2) Qualitative forecast
Let's see what it is
1) Quantitative forecast
The quantitative forecast is made based on historical data (i, e) Past and present data, mainly numerical data. Through these historical data, we use statistical methods and, Thus, we can predict with less bias.
2) Qualitative forecast
The qualitative forecast is made based on the opinion and judgment of subject matter experts and clients. Why do we rely on judgment instead of data? Because in some cases, the above data is not available or unclear. so here we depend on judgment and opinions.
You may have some doubts about regression and time series. They both have some similarities and differences.
Regression versus time series
Regression analysis and time series analysis are performed on continuous variables.
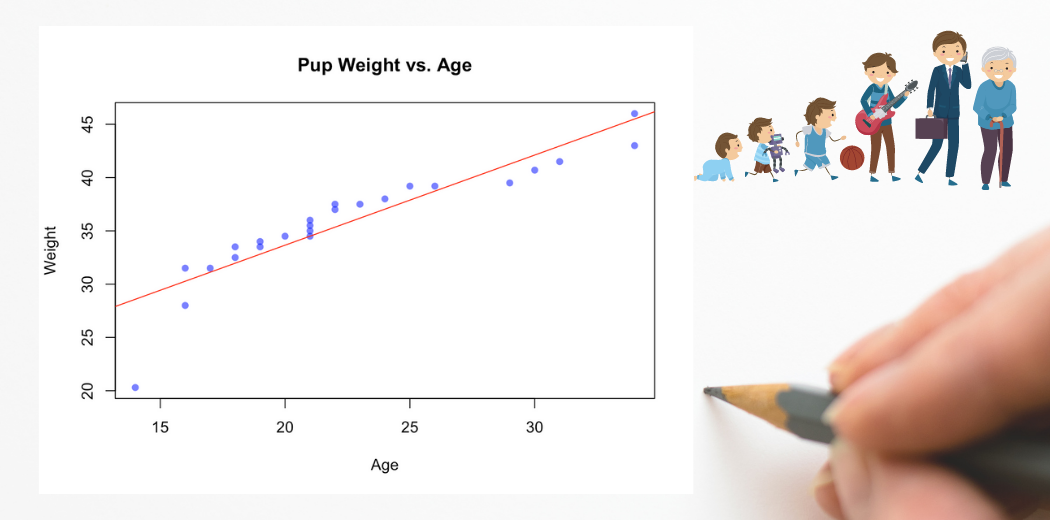
Regression
→ It is the relationship between dependent and independent variables.
→ La variableIn statistics and mathematics, a "variable" is a symbol that represents a value that can change or vary. There are different types of variables, and qualitative, that describe non-numerical characteristics, and quantitative, representing numerical quantities. Variables are fundamental in experiments and studies, since they allow the analysis of relationships and patterns between different elements, facilitating the understanding of complex phenomena.... objetivo es continua.
→ This involves finding patterns in the data and predicting the target with this pattern.
Time series
→ It is the series of data points associated with time.
→ The target variable is continuous.
→ This involves finding trends in the data and forecasting the future with this trend.
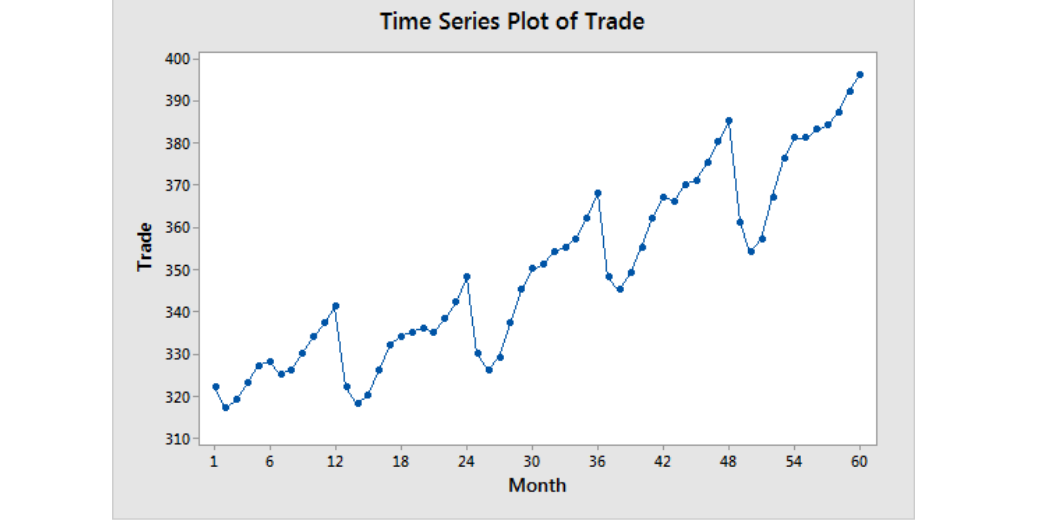
Time series: https://i1.wp.com/statisticsbyjim.com/wp-content/uploads/2020/07/TimeSeriesTrade.png?fit=576,384&ssl=1
Time series components
The time series chart helps highlight the trend and behavior of the data over time to build a more reliable model. To understand these patterns, we must structure this data and break it down into several factors. We use several components to break down this data. Son,
Structural breaks
Trend
Seasonality
Cyclicality
Noise
Level
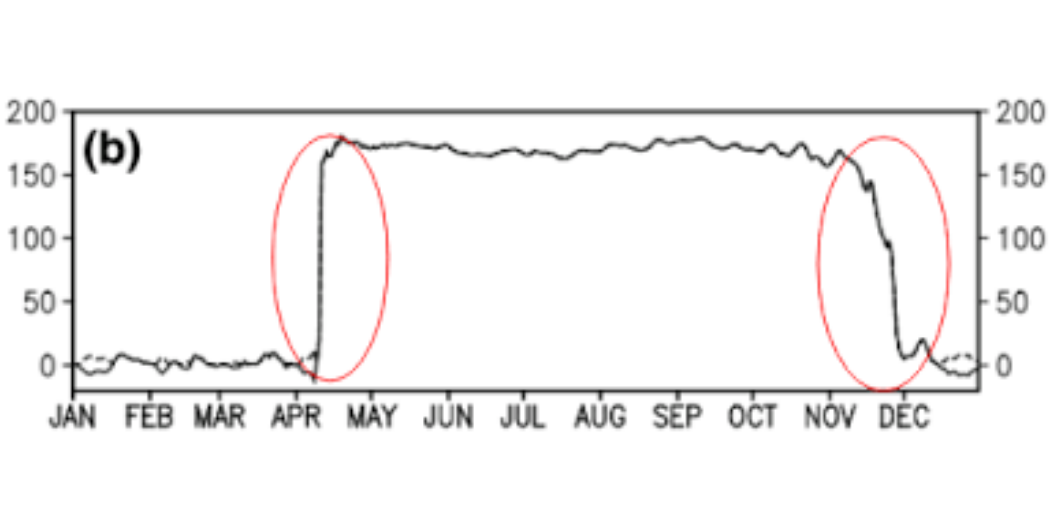
1) Structural breaks
It is a component that shows some sudden change in the time series data. This structural break affects the reliability of the results.. Statistical methods should be used to identify structural breaks.
2) Trend
Time series data can have something that is proportional to time period. There the trend occurs. In summary, “Trend” is the demonstration of whether the time series has moved up or down over a period of time. Reliability of time series results is based on correct identification of time trends.
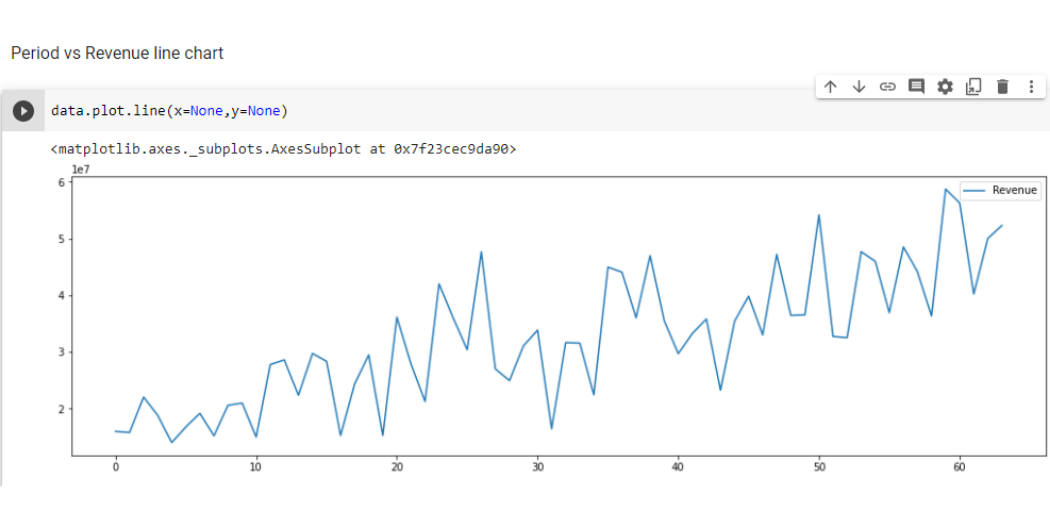
Then, an example is shown, the monthly income of a company. This shows an increasing trend
3) Seasonality
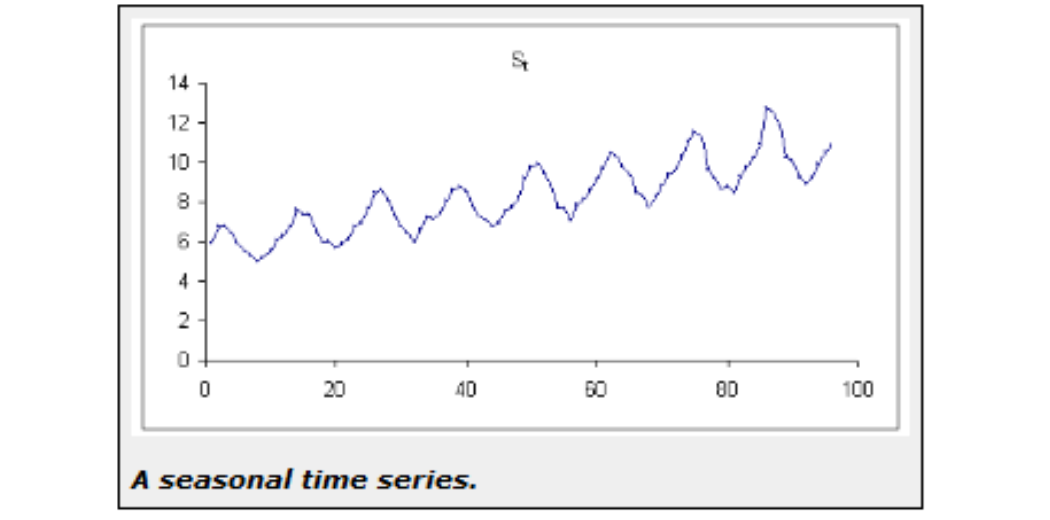
Seasonality is also a component in which the time series data shows a regular pattern over a time interval.. Repeats after the fixed time interval.
(An example of a time series with seasonality is sales, which often increase every 20 days)
4) Cyclicality
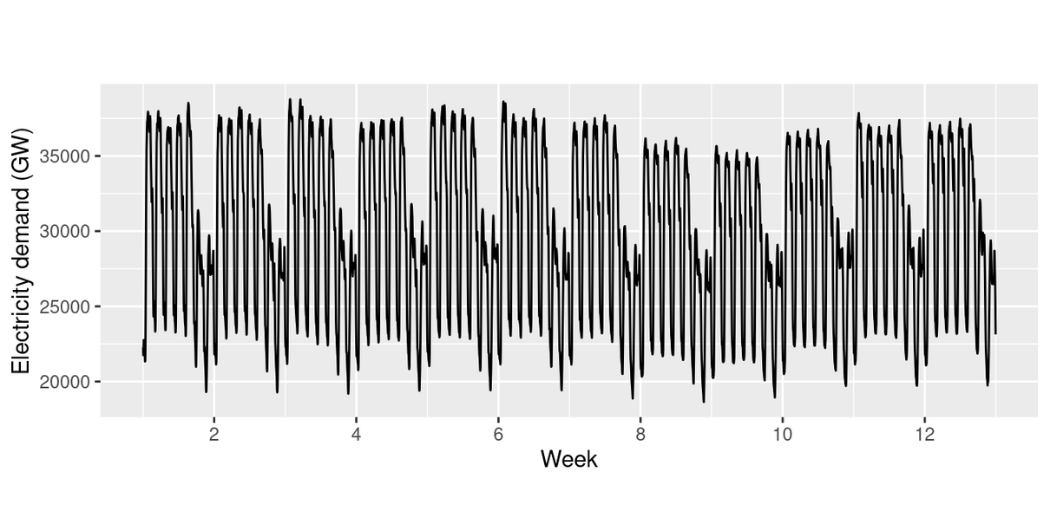
Cyclicity is the component in which the time series data repeats after a time interval. The interval is not set here.
Example:
Electricity demand per week is plotted on a time series chart. The demand for 2 weeks repeats cyclically. This represents cyclicality.
https://robjhyndman.com/hyndsight/2011-12-14-cyclicts_files/figure-html/unnamed-chunk-3-1.png
5) noise
Noise is the random fluctuation in the time series data. We cannot consider them to predict the future.
6) Level
The average time series is called the level.
Kaggle time series data analysis:
In this analysis, i have used Kaggledata set. Kaggle is a platform where we can find data sets, notebooks and other kinds of things related to data science. Competitions are also organized for practice.
Data set used in this analysis: Time series start data set
Read the data set
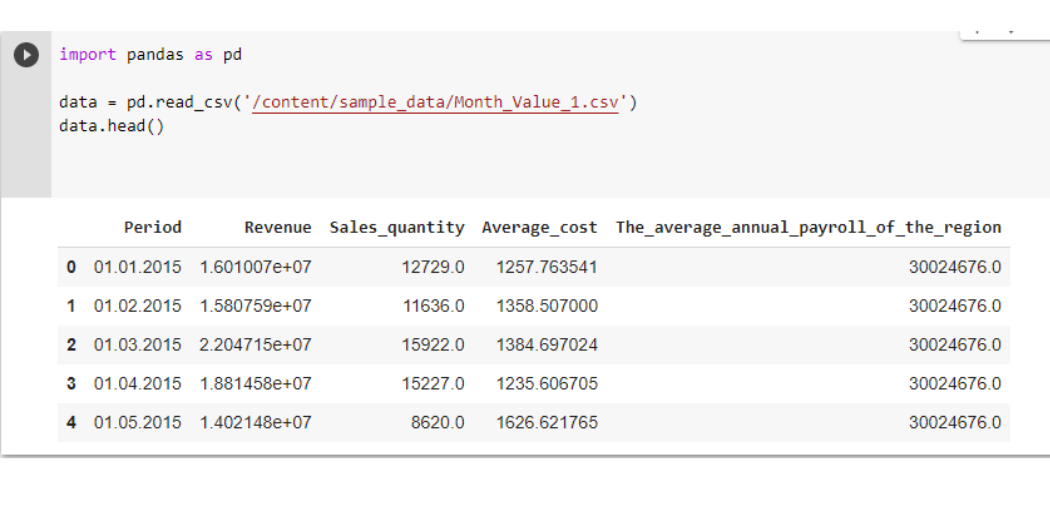
import pandas as pd
data = pd.read_csv('/content/sample_data/Month_Value_1.csv')
data.head()
Dataset cleanup:
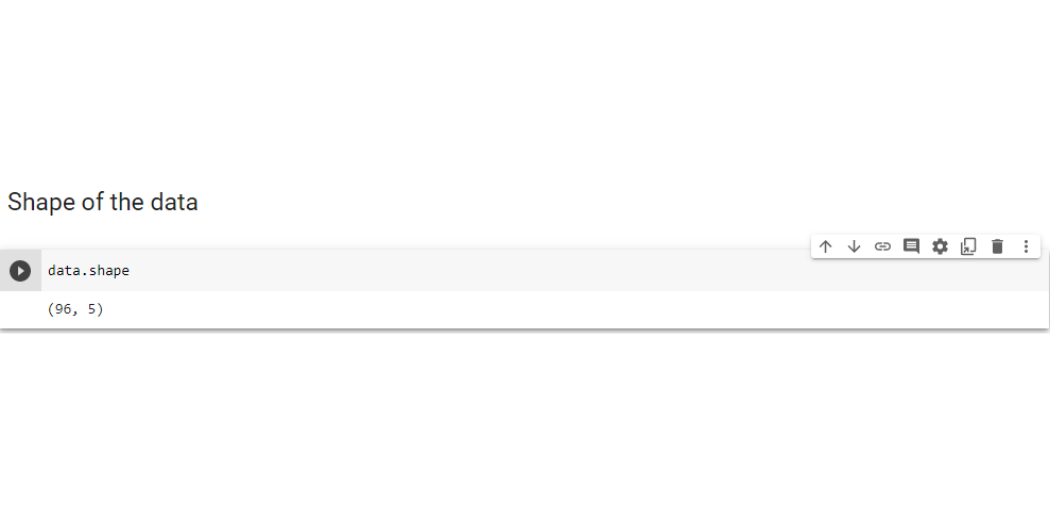
This dataset contains 5 columns and 96 rows.
The columns are
[0] – Time course
[1] – Income
[2] – Sales quantity
[3] – Average cost
[4] – The_average_anual_payer_of_the_region
Description of each column to decide which is important
Time course: contains the model period. The monthly wise date of 2015 a 2020 specified here.
Income: the company's revenue for each month from 2015 until 2020.
Sales_quantity: company sales amount
Average_cost: average production cost
The_average_annual_payroll_of_the_region: the average number of employees in the region per year.
Trazar el line graphThe line chart is a visual tool used to represent data over time. It consists of a series of points connected by lines, which allows you to observe trends, Fluctuations and patterns in the data. This type of chart is especially useful in areas such as economics, Meteorology and scientific research, making it easier to compare different data sets and identify behaviors across the board.. to 5 columns
data.plot.line(x=none,y=none)
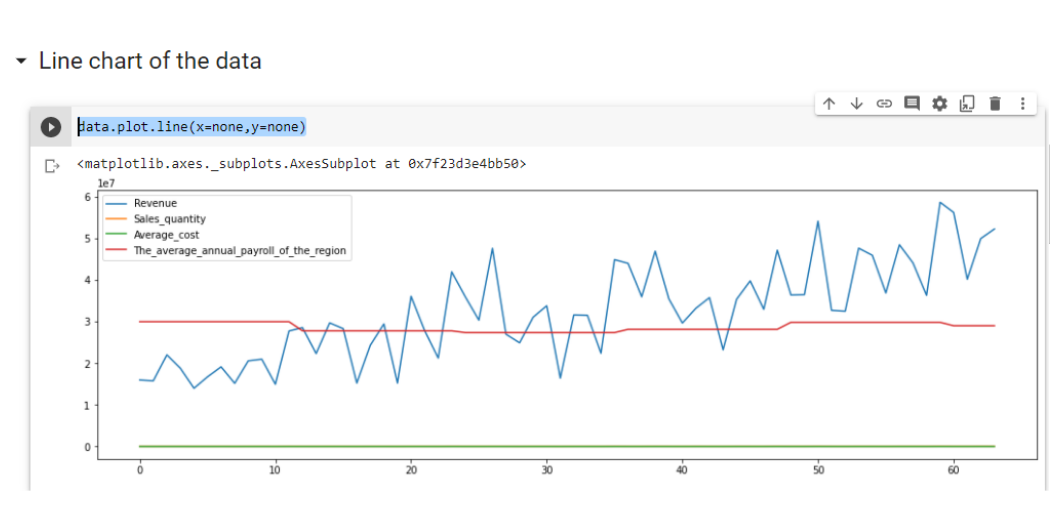
Contains all data from 5 columns. So it doesn't give an exact view. Then
Let's clean up the dataset.
We can analyze the time series of income from 2015 a 2020 and remove all other columns now.
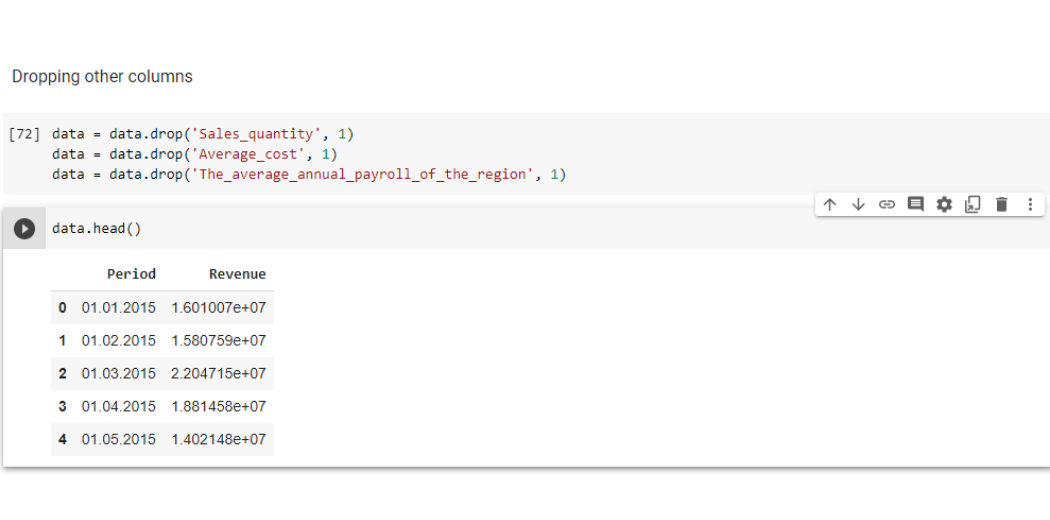
data = data.drop('Sales_quantity', 1)
data = data.drop('Average_cost', 1)
data = data.drop('The_average_annual_payroll_of_the_region', 1)
The syntax for removing the column is
dataframe.drop('Column_name',1)
where 1 is the axis number (0 for rows and 1 for columns)
Now we only have period and income columns for analysis.
Let's draw the graph
data.plot.line(x=None,y=None)
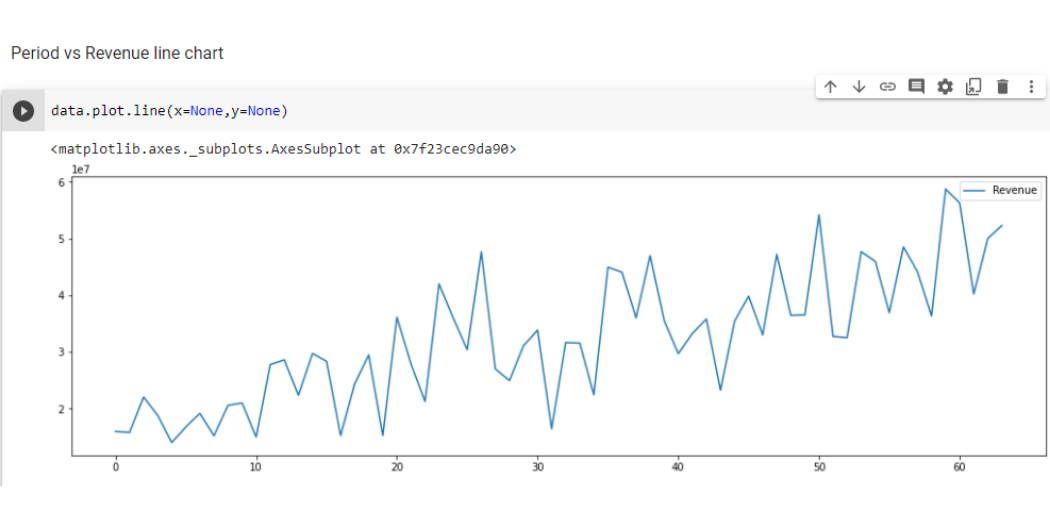
This time series chart shows the increasing trend. Then, the company's income increases from 2015 a 2020.
You can take a look at this time series notebook to see the code:
Time Series Startup Data Set Notebook
Final notes
We have looked at some concepts of time series analysis and analyzed Kaggle's starting data set for time series.
Thank you for reading!
Hope you enjoyed the article and increased your knowledge of time series analysis. Please feel free to contact me a [email protected] Linkedin
You want to share your thoughts? Feel free to comment below
About the Author
Mohamed Illiyas
Nowadays, I am pursuing my Bachelor of Engineering (BE) in Computer Science from the Government Engineering School, Srirangam, Tamil Nadu. I am very excited about the statistics, machine learning and data science.
Connect with me on Linkedin Mohamed Illiyas
The media shown in this article explaining how to implement the Streamlit app on Heroku is not the property of DataPeaker and is used at the author's discretion.





